|
Download Data (XLS File) |
|
||||||||
|
||||||||
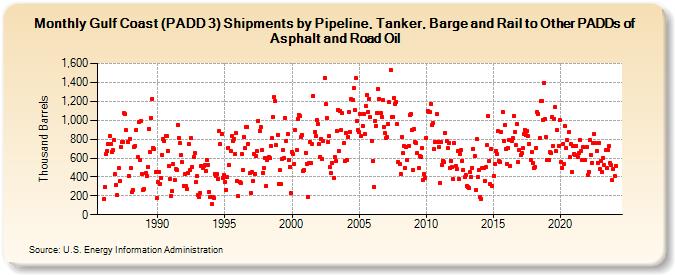
| Gulf Coast (PADD 3) Shipments by Pipeline, Tanker, and Barge to Other PADDs of Asphalt and Road Oil (Thousand Barrels) | ||||||||
| Year | Jan | Feb | Mar | Apr | May | Jun | Jul | Aug | Sep | Oct | Nov | Dec |
|---|---|---|---|---|---|---|---|---|---|---|---|---|
| 1986 | 171 | 292 | 638 | 679 | 744 | 834 | 751 | 666 | 683 | 793 | 427 | 318 |
| 1987 | 208 | 491 | 352 | 720 | 769 | 772 | 1,071 | 1,065 | 892 | 770 | 407 | 806 |
| 1988 | 489 | 237 | 265 | 718 | 727 | 901 | 606 | 978 | 583 | 991 | 434 | 263 |
| 1989 | 269 | 438 | 408 | 509 | 912 | 664 | 1,027 | 1,228 | 708 | 690 | 451 | 172 |
| 1990 | 348 | 450 | 321 | 389 | 636 | 804 | 776 | 831 | 833 | 679 | 519 | 383 |
| 1991 | 200 | 248 | 534 | 365 | 485 | 475 | 954 | 810 | 754 | 630 | 553 | 307 |
| 1992 | 426 | 307 | 269 | 443 | 743 | 473 | 810 | 505 | 614 | 649 | 343 | 410 |
| 1993 | 213 | 192 | 232 | 519 | 498 | 511 | 525 | 464 | 577 | 527 | 245 | 184 |
| 1994 | 110 | 189 | 175 | 435 | 413 | 427 | 377 | 881 | 745 | 851 | 393 | 419 |
| 1995 | 350 | 259 | 396 | 711 | 523 | 673 | 829 | 784 | 797 | 644 | 861 | 357 |
| 1996 | 195 | 346 | 331 | 643 | 473 | 827 | 705 | 930 | 928 | 751 | 437 | 228 |
| 1997 | 453 | 359 | 644 | 431 | 621 | 670 | 995 | 884 | 925 | 682 | 445 | 499 |
| 1998 | 604 | 307 | 581 | 607 | 599 | 726 | 810 | 1,030 | 1,246 | 1,198 | 737 | 848 |
| 1999 | 327 | 473 | 326 | 585 | 681 | 598 | 1,026 | 785 | 854 | 575 | 510 | 229 |
| 2000 | 668 | 641 | 540 | 892 | 687 | 1,011 | 1,055 | 1,046 | 826 | 845 | 461 | 474 |
| 2001 | 656 | 537 | 185 | 547 | 769 | 545 | 753 | 1,258 | 878 | 829 | 1,000 | 962 |
| 2002 | 744 | 615 | 804 | 589 | 783 | 1,451 | 1,167 | 1,024 | 771 | 831 | 506 | 438 |
| 2003 | 546 | 392 | 609 | 569 | 888 | 1,111 | 676 | 1,102 | 891 | 1,073 | 758 | 564 |
| 2004 | 867 | 580 | 820 | 1,091 | 879 | 1,220 | 1,218 | 1,341 | 1,111 | 1,447 | 990 | 895 |
| 2005 | 873 | 1,067 | 835 | 941 | 1,068 | 859 | 1,151 | 1,270 | 1,091 | 1,229 | 1,032 | 784 |
| 2006 | 568 | 296 | 995 | 943 | 1,078 | 1,332 | 1,225 | 1,080 | 1,036 | 1,216 | 928 | 860 |
| 2007 | 808 | 819 | 961 | 1,188 | 1,535 | 1,036 | 1,035 | 1,234 | 1,173 | 1,197 | 960 | 559 |
| 2008 | 540 | 435 | 824 | 648 | 728 | 498 | 713 | 584 | 729 | 1,054 | 1,064 | 895 |
| 2009 | 474 | 909 | 768 | 759 | 649 | 489 | 619 | 614 | 702 | 372 | 428 | 392 |
| 2010 | 814 | 1,102 | 1,087 | 1,083 | 1,176 | 944 | 968 | 693 | 774 | 1,062 | 770 | 718 |
| 2011 | 338 | 767 | 528 | 573 | 554 | 868 | 775 | 702 | 763 | 497 | 573 | 500 |
| 2012 | 374 | 758 | 518 | 479 | 676 | 381 | 645 | 686 | 571 | 475 | 394 | 420 |
| 2013 | 302 | 288 | 282 | 451 | 398 | 496 | 698 | 619 | 259 | 800 | 400 | 474 |
| 2014 | 188 | 167 | 498 | 499 | 360 | 501 | 733 | 1,043 | 563 | 322 | 694 | 307 |
| 2015 | 410 | 540 | 679 | 645 | 883 | 564 | 557 | 879 | 1,089 | 780 | 948 | 691 |
| 2016 | 541 | 708 | 795 | 519 | 777 | 809 | 1,049 | 876 | 733 | 958 | 560 | 689 |
| 2017 | 631 | 654 | 701 | 853 | 900 | 839 | 889 | 828 | 751 | 584 | 667 | 549 |
| 2018 | 495 | 505 | 704 | 1,083 | 1,065 | 809 | 1,199 | 1,208 | 1,003 | 1,397 | 1,014 | 818 |
| 2019 | 574 | 578 | 661 | 649 | 1,033 | 725 | 1,013 | 1,138 | 669 | 891 | 726 | 1,002 |
| 2020 | 557 | 496 | 752 | 537 | 934 | 703 | 789 | 877 | 607 | 745 | 450 | 728 |
| 2021 | 647 | 633 | 732 | 615 | 652 | 789 | 670 | 577 | 712 | 584 | 577 | 718 |
| 2022 | 418 | 456 | 791 | 629 | 552 | 761 | 856 | 761 | 675 | 552 | 763 | 479 |
| 2023 | 565 | 453 | 601 | 522 | 681 | 489 | 682 | 729 | 550 | 522 | 363 | 483 |
| 2024 | 414 | |||||||||||
| - = No Data Reported; -- = Not Applicable; NA = Not Available; W = Withheld to avoid disclosure of individual company data. |
| Release Date: 3/29/2024 |
| Next Release Date: 4/30/2024 |