|
Download Data (XLS File) |
|
||||||||
|
||||||||
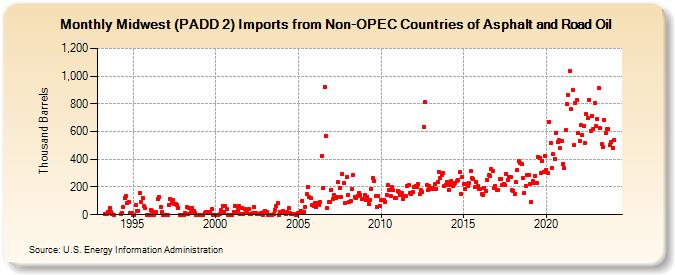
| Midwest (PADD 2) Imports from Non-OPEC Countries of Asphalt and Road Oil (Thousand Barrels) | ||||||||
| Year | Jan | Feb | Mar | Apr | May | Jun | Jul | Aug | Sep | Oct | Nov | Dec |
|---|---|---|---|---|---|---|---|---|---|---|---|---|
| 1993 | 3 | 4 | 22 | 50 | 18 | 2 | 1 | |||||
| 1994 | 2 | 15 | 54 | 123 | 136 | 83 | 91 | 9 | 9 | |||
| 1995 | 0 | 0 | 69 | 30 | 27 | 160 | 93 | 120 | 64 | 47 | 0 | 0 |
| 1996 | 0 | 35 | 30 | 0 | 14 | 19 | 113 | 129 | 56 | 19 | 1 | 0 |
| 1997 | 0 | 0 | 68 | 114 | 87 | 106 | 80 | 74 | 70 | 52 | 1 | 0 |
| 1998 | 0 | 0 | 12 | 53 | 3 | 47 | 20 | 48 | 28 | 11 | 0 | 0 |
| 1999 | 0 | 0 | 0 | 0 | 14 | 18 | 14 | 19 | 22 | 41 | 0 | 0 |
| 2000 | 0 | 0 | 1 | 2 | 31 | 62 | 17 | 64 | 43 | 0 | 0 | 0 |
| 2001 | 0 | 20 | 63 | 23 | 33 | 63 | 3 | 47 | 8 | 40 | 11 | 10 |
| 2002 | 42 | 5 | 3 | 9 | 54 | 13 | 7 | 4 | 2 | 14 | 0 | 19 |
| 2003 | 25 | 20 | 0 | 0 | 1 | 1 | 6 | 37 | 60 | 84 | 0 | 23 |
| 2004 | 20 | 27 | 5 | 20 | 50 | 10 | 7 | 6 | 8 | 1 | ||
| 2005 | 12 | 11 | 30 | 101 | 18 | 59 | 149 | 201 | 126 | 120 | 70 | 62 |
| 2006 | 81 | 58 | 87 | 67 | 89 | 423 | 195 | 923 | 571 | 49 | 89 | 92 |
| 2007 | 180 | 112 | 144 | 121 | 130 | 234 | 192 | 125 | 292 | 226 | 86 | 271 |
| 2008 | 143 | 91 | 101 | 183 | 285 | 126 | 124 | 136 | 160 | 144 | 112 | 110 |
| 2009 | 142 | 103 | 130 | 76 | 109 | 189 | 264 | 243 | 132 | 59 | 133 | 64 |
| 2010 | 103 | 108 | 105 | 92 | 142 | 212 | 176 | 133 | 200 | 180 | 123 | 117 |
| 2011 | 172 | 162 | 143 | 156 | 111 | 137 | 136 | 208 | 212 | 157 | 146 | 167 |
| 2012 | 199 | 206 | 199 | 218 | 147 | 175 | 167 | 634 | 812 | 214 | 176 | 205 |
| 2013 | 191 | 188 | 191 | 223 | 189 | 238 | 310 | 262 | 287 | 298 | 207 | 213 |
| 2014 | 237 | 181 | 211 | 246 | 207 | 218 | 230 | 243 | 253 | 305 | 153 | 273 |
| 2015 | 222 | 186 | 221 | 205 | 226 | 312 | 265 | 259 | 197 | 234 | 206 | 184 |
| 2016 | 188 | 149 | 145 | 193 | 169 | 249 | 283 | 281 | 331 | 312 | 190 | 204 |
| 2017 | 181 | 180 | 256 | 257 | 214 | 222 | 213 | 296 | 250 | 271 | 275 | 175 |
| 2018 | 172 | 151 | 235 | 323 | 385 | 371 | 364 | 268 | 156 | 208 | 290 | 290 |
| 2019 | 219 | 94 | 241 | 231 | 282 | 228 | 420 | 412 | 299 | 386 | 311 | 421 |
| 2020 | 323 | 300 | 672 | 515 | 338 | 436 | 404 | 591 | 524 | 538 | 479 | 532 |
| 2021 | 369 | 335 | 608 | 797 | 862 | 1,036 | 760 | 901 | 502 | 807 | 828 | 588 |
| 2022 | 534 | 646 | 575 | 642 | 515 | 724 | 698 | 830 | 606 | 714 | 618 | 803 |
| 2023 | 638 | 688 | 912 | 626 | 511 | 486 | 686 | 588 | 618 | 617 | 505 | 524 |
| 2024 | 480 | |||||||||||
| - = No Data Reported; -- = Not Applicable; NA = Not Available; W = Withheld to avoid disclosure of individual company data. |
| Release Date: 3/29/2024 |
| Next Release Date: 4/30/2024 |