|
Download Data (XLS File) |
|
||||||||
|
||||||||
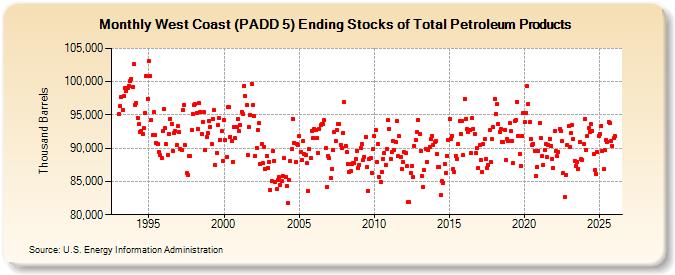
| West Coast (PADD 5) Ending Stocks of Total Petroleum Products (Thousand Barrels) | ||||||||
| Year | Jan | Feb | Mar | Apr | May | Jun | Jul | Aug | Sep | Oct | Nov | Dec |
|---|---|---|---|---|---|---|---|---|---|---|---|---|
| 1993 | 95,114 | 96,323 | 97,627 | 95,723 | 97,833 | 98,999 | 98,590 | 98,980 | 99,327 | 100,073 | 100,406 | 99,181 |
| 1994 | 102,632 | 96,425 | 96,769 | 94,578 | 93,628 | 92,363 | 92,627 | 92,196 | 93,031 | 95,293 | 100,860 | 97,431 |
| 1995 | 103,110 | 100,808 | 94,265 | 91,979 | 95,424 | 91,979 | 90,785 | 90,574 | 89,432 | 88,918 | 88,451 | 92,596 |
| 1996 | 95,862 | 93,089 | 90,571 | 88,983 | 92,205 | 94,396 | 93,630 | 89,637 | 92,294 | 92,556 | 90,527 | 93,262 |
| 1997 | 92,359 | 89,935 | 89,769 | 95,691 | 96,551 | 90,436 | 86,214 | 85,964 | 88,877 | 88,792 | 92,763 | 95,129 |
| 1998 | 96,499 | 96,568 | 95,319 | 92,873 | 96,804 | 95,511 | 92,144 | 93,985 | 95,374 | 89,760 | 91,656 | 92,230 |
| 1999 | 94,150 | 93,240 | 90,647 | 94,365 | 95,695 | 87,469 | 89,339 | 93,427 | 94,603 | 91,289 | 92,530 | 88,122 |
| 2000 | 94,213 | 91,200 | 88,726 | 96,117 | 96,163 | 91,742 | 91,145 | 87,965 | 93,227 | 91,476 | 93,194 | 94,452 |
| 2001 | 92,509 | 93,447 | 95,496 | 95,106 | 99,341 | 97,866 | 96,419 | 88,945 | 93,170 | 95,024 | 99,674 | 96,517 |
| 2002 | 94,774 | 88,854 | 90,011 | 92,789 | 93,785 | 87,564 | 90,696 | 87,732 | 90,245 | 86,837 | 88,893 | 87,079 |
| 2003 | 87,993 | 83,677 | 85,088 | 89,586 | 88,095 | 84,955 | 83,798 | 85,229 | 85,649 | 84,530 | 85,046 | 85,783 |
| 2004 | 88,484 | 85,640 | 84,249 | 81,703 | 85,159 | 88,031 | 89,864 | 94,388 | 90,816 | 87,897 | 90,634 | 90,538 |
| 2005 | 91,780 | 89,402 | 88,202 | 91,020 | 89,131 | 88,971 | 87,720 | 83,572 | 89,854 | 88,597 | 92,600 | 91,542 |
| 2006 | 92,878 | 92,663 | 91,513 | 89,331 | 92,910 | 93,411 | 93,611 | 93,595 | 94,172 | 90,006 | 84,217 | 88,845 |
| 2007 | 88,475 | 85,517 | 86,923 | 89,733 | 92,462 | 91,048 | 92,751 | 93,699 | 93,633 | 90,510 | 90,083 | 92,296 |
| 2008 | 96,907 | 90,402 | 89,387 | 87,680 | 86,424 | 86,517 | 87,608 | 87,739 | 87,736 | 88,393 | 89,617 | 87,020 |
| 2009 | 87,505 | 90,012 | 90,618 | 88,167 | 88,734 | 91,720 | 87,119 | 83,617 | 88,326 | 88,498 | 86,330 | 89,923 |
| 2010 | 91,832 | 92,764 | 87,875 | 90,653 | 85,642 | 84,980 | 86,474 | 88,446 | 89,253 | 87,529 | 89,947 | 94,206 |
| 2011 | 92,950 | 88,350 | 89,387 | 91,082 | 89,762 | 90,995 | 94,024 | 88,768 | 91,771 | 88,603 | 86,933 | 87,895 |
| 2012 | 89,459 | 89,274 | 87,270 | 81,886 | 81,867 | 86,279 | 87,388 | 85,697 | 90,345 | 91,218 | 92,429 | 94,239 |
| 2013 | 92,194 | 89,554 | 85,820 | 84,093 | 86,696 | 89,908 | 87,909 | 89,764 | 90,221 | 91,323 | 91,798 | 90,541 |
| 2014 | 90,957 | 91,071 | 89,123 | 87,245 | 87,194 | 82,894 | 84,993 | 84,808 | 87,662 | 86,270 | 88,878 | 91,253 |
| 2015 | 94,319 | 91,452 | 91,901 | 86,833 | 86,442 | 88,848 | 88,327 | 90,631 | 94,089 | 92,118 | 94,156 | 89,008 |
| 2016 | 97,397 | 94,343 | 92,880 | 92,409 | 92,689 | 89,262 | 94,475 | 92,888 | 92,203 | 89,205 | 89,997 | 87,040 |
| 2017 | 90,481 | 88,190 | 86,421 | 90,579 | 91,368 | 88,404 | 87,086 | 87,398 | 92,722 | 87,951 | 91,307 | 93,132 |
| 2018 | 97,424 | 95,168 | 96,615 | 93,704 | 92,469 | 92,868 | 90,957 | 90,862 | 92,796 | 88,151 | 91,327 | 91,148 |
| 2019 | 93,731 | 92,522 | 91,133 | 87,752 | 94,030 | 94,231 | 96,952 | 91,888 | 89,172 | 87,357 | 91,762 | 95,233 |
| 2020 | 93,909 | 95,311 | 99,341 | 96,623 | 93,912 | 91,410 | 90,507 | 90,694 | 89,613 | 85,812 | 87,183 | 89,597 |
| 2021 | 93,847 | 91,460 | 88,752 | 87,541 | 89,679 | 90,578 | 88,600 | 90,526 | 91,446 | 90,387 | 88,419 | 87,061 |
| 2022 | 92,619 | 89,533 | 88,808 | 89,467 | 92,930 | 92,556 | 91,021 | 86,206 | 82,623 | 86,028 | 90,430 | 93,277 |
| 2023 | 90,243 | 92,255 | 93,530 | 91,349 | 88,132 | 87,330 | 87,941 | 86,889 | 90,990 | 88,317 | 88,289 | 90,686 |
| 2024 | 94,287 | 89,564 | 91,851 | 92,829 | 92,270 | 93,225 | ||||||
| - = No Data Reported; -- = Not Applicable; NA = Not Available; W = Withheld to avoid disclosure of individual company data. |
| Release Date: 8/30/2024 |
| Next Release Date: 9/30/2024 |