|
Download Data (XLS File) |
|
||||||||
|
||||||||
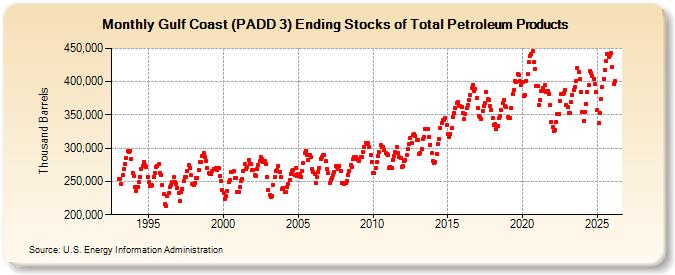
| Gulf Coast (PADD 3) Ending Stocks of Total Petroleum Products (Thousand Barrels) | ||||||||
| Year | Jan | Feb | Mar | Apr | May | Jun | Jul | Aug | Sep | Oct | Nov | Dec |
|---|---|---|---|---|---|---|---|---|---|---|---|---|
| 1993 | 253,621 | 254,225 | 246,631 | 258,948 | 269,451 | 275,918 | 285,607 | 295,286 | 294,589 | 296,495 | 284,176 | 263,001 |
| 1994 | 257,841 | 241,480 | 235,774 | 242,096 | 248,444 | 257,154 | 269,021 | 273,622 | 279,059 | 274,234 | 271,449 | 257,294 |
| 1995 | 248,754 | 243,617 | 243,908 | 244,128 | 256,913 | 262,798 | 271,848 | 273,262 | 276,169 | 263,300 | 260,164 | 244,330 |
| 1996 | 230,968 | 215,978 | 213,723 | 228,555 | 232,044 | 241,181 | 245,173 | 249,363 | 256,078 | 249,179 | 246,328 | 240,348 |
| 1997 | 233,204 | 220,508 | 234,583 | 238,788 | 250,418 | 256,010 | 256,911 | 265,180 | 274,700 | 270,232 | 259,204 | 245,732 |
| 1998 | 244,587 | 247,470 | 255,112 | 255,721 | 267,332 | 279,144 | 279,595 | 288,692 | 292,760 | 286,295 | 281,258 | 269,970 |
| 1999 | 262,697 | 261,399 | 260,449 | 265,200 | 268,305 | 268,530 | 270,631 | 266,506 | 269,767 | 258,541 | 250,822 | 236,654 |
| 2000 | 232,815 | 223,582 | 228,786 | 236,311 | 248,912 | 252,432 | 264,158 | 264,916 | 265,151 | 255,594 | 255,375 | 234,748 |
| 2001 | 233,676 | 241,670 | 250,375 | 253,219 | 265,133 | 275,600 | 268,423 | 271,604 | 282,740 | 276,883 | 275,545 | 266,696 |
| 2002 | 267,171 | 259,773 | 258,074 | 268,493 | 274,196 | 280,813 | 286,395 | 283,348 | 279,060 | 280,074 | 276,502 | 256,158 |
| 2003 | 237,393 | 230,135 | 225,947 | 227,618 | 245,368 | 256,924 | 265,334 | 267,404 | 272,549 | 264,484 | 256,002 | 238,831 |
| 2004 | 239,781 | 234,476 | 234,664 | 241,093 | 245,476 | 251,895 | 260,552 | 265,417 | 267,562 | 259,724 | 270,950 | 258,783 |
| 2005 | 261,578 | 260,099 | 256,901 | 265,328 | 276,991 | 292,181 | 295,367 | 289,119 | 281,944 | 289,715 | 286,448 | 269,411 |
| 2006 | 264,144 | 261,316 | 248,158 | 256,708 | 264,099 | 270,078 | 284,241 | 286,389 | 290,196 | 289,969 | 280,257 | 267,995 |
| 2007 | 262,367 | 247,370 | 251,561 | 255,899 | 260,173 | 264,372 | 273,538 | 271,874 | 268,470 | 273,667 | 266,408 | 248,348 |
| 2008 | 247,447 | 245,829 | 247,072 | 250,254 | 259,213 | 265,939 | 274,194 | 271,524 | 283,054 | 286,212 | 286,573 | 283,887 |
| 2009 | 281,594 | 281,017 | 286,899 | 285,999 | 294,539 | 302,318 | 307,834 | 305,744 | 307,101 | 301,473 | 289,240 | 279,002 |
| 2010 | 263,184 | 262,201 | 270,713 | 279,573 | 288,741 | 293,599 | 304,730 | 301,871 | 301,282 | 297,237 | 293,008 | 291,992 |
| 2011 | 289,124 | 269,916 | 272,098 | 270,299 | 282,179 | 287,743 | 294,279 | 302,157 | 293,455 | 286,666 | 284,772 | 271,696 |
| 2012 | 273,085 | 280,408 | 282,205 | 289,232 | 298,043 | 305,862 | 315,002 | 308,216 | 319,792 | 320,654 | 318,122 | 311,966 |
| 2013 | 312,636 | 291,958 | 293,089 | 298,182 | 313,476 | 316,990 | 328,348 | 329,105 | 328,484 | 317,234 | 305,365 | 292,181 |
| 2014 | 280,659 | 278,289 | 278,876 | 291,911 | 305,715 | 314,551 | 330,477 | 337,713 | 342,710 | 342,682 | 344,792 | 334,727 |
| 2015 | 321,840 | 316,950 | 321,418 | 330,334 | 346,300 | 352,577 | 360,437 | 367,951 | 369,089 | 364,142 | 362,881 | 361,872 |
| 2016 | 352,741 | 343,359 | 351,684 | 359,974 | 364,800 | 372,061 | 379,442 | 390,689 | 395,117 | 385,321 | 388,832 | 375,680 |
| 2017 | 360,265 | 348,293 | 347,012 | 343,298 | 356,619 | 363,138 | 368,184 | 384,444 | 373,471 | 373,032 | 363,423 | 357,562 |
| 2018 | 344,640 | 334,706 | 335,920 | 329,235 | 333,510 | 344,780 | 348,230 | 357,033 | 367,929 | 373,071 | 363,410 | 362,371 |
| 2019 | 347,149 | 344,969 | 345,851 | 361,134 | 380,802 | 387,578 | 401,570 | 400,067 | 412,075 | 409,628 | 400,850 | 394,737 |
| 2020 | 398,954 | 378,963 | 379,869 | 401,099 | 411,407 | 429,068 | 438,385 | 442,297 | 446,050 | 429,829 | 418,860 | 393,909 |
| 2021 | 393,645 | 365,426 | 372,204 | 386,133 | 391,197 | 385,810 | 394,867 | 384,548 | 386,575 | 381,832 | 365,394 | 339,735 |
| 2022 | 331,464 | 325,585 | 327,178 | 339,517 | 350,638 | 351,712 | 371,183 | 381,335 | 381,507 | 382,888 | 387,913 | 364,358 |
| 2023 | 363,379 | 353,582 | 352,967 | 369,306 | 380,777 | 388,288 | 392,439 | 401,020 | 421,899 | 414,088 | 406,826 | 386,433 |
| 2024 | 355,971 | |||||||||||
| - = No Data Reported; -- = Not Applicable; NA = Not Available; W = Withheld to avoid disclosure of individual company data. |
| Release Date: 3/29/2024 |
| Next Release Date: 4/30/2024 |