|
Download Data (XLS File) |
|
||||||||
|
||||||||
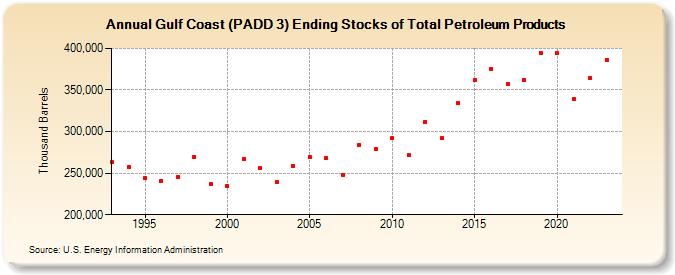
| Gulf Coast (PADD 3) Ending Stocks of Total Petroleum Products (Thousand Barrels) | ||||||||
| Decade | Year-0 | Year-1 | Year-2 | Year-3 | Year-4 | Year-5 | Year-6 | Year-7 | Year-8 | Year-9 |
|---|---|---|---|---|---|---|---|---|---|---|
| 1990's | 263,001 | 257,294 | 244,330 | 240,348 | 245,732 | 269,970 | 236,654 | |||
| 2000's | 234,748 | 266,696 | 256,158 | 238,831 | 258,783 | 269,411 | 267,995 | 248,348 | 283,887 | 279,002 |
| 2010's | 291,992 | 271,696 | 311,966 | 292,181 | 334,727 | 361,872 | 375,680 | 357,562 | 362,371 | 394,737 |
| 2020's | 393,909 | 339,735 | 364,358 | 386,433 |
| - = No Data Reported; -- = Not Applicable; NA = Not Available; W = Withheld to avoid disclosure of individual company data. |
| Release Date: 3/29/2024 |
| Next Release Date: 8/30/2024 |