|
Download Data (XLS File) |
|
||||||||
|
||||||||
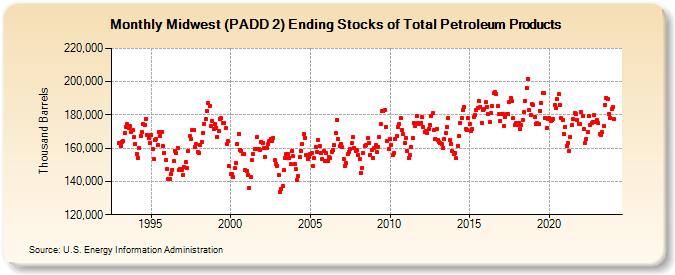
| Midwest (PADD 2) Ending Stocks of Total Petroleum Products (Thousand Barrels) | ||||||||
| Year | Jan | Feb | Mar | Apr | May | Jun | Jul | Aug | Sep | Oct | Nov | Dec |
|---|---|---|---|---|---|---|---|---|---|---|---|---|
| 1993 | 163,074 | 161,478 | 164,002 | 164,321 | 169,130 | 172,752 | 174,646 | 172,060 | 173,330 | 169,773 | 171,207 | 166,515 |
| 1994 | 162,448 | 156,803 | 154,246 | 159,817 | 167,600 | 169,450 | 174,269 | 174,001 | 177,457 | 168,032 | 165,944 | 163,074 |
| 1995 | 167,992 | 159,254 | 153,459 | 165,028 | 165,303 | 162,150 | 169,847 | 167,355 | 169,953 | 161,134 | 157,336 | 152,817 |
| 1996 | 147,542 | 141,638 | 141,288 | 144,342 | 147,182 | 152,255 | 158,442 | 156,909 | 160,403 | 147,174 | 147,525 | 147,106 |
| 1997 | 143,967 | 148,405 | 151,602 | 148,073 | 158,179 | 167,188 | 165,648 | 171,207 | 170,807 | 160,964 | 162,226 | 157,738 |
| 1998 | 157,248 | 162,209 | 163,788 | 169,198 | 174,727 | 177,363 | 182,558 | 187,035 | 185,405 | 173,100 | 176,582 | 171,745 |
| 1999 | 174,349 | 172,376 | 166,553 | 170,526 | 177,582 | 177,940 | 175,060 | 175,092 | 172,039 | 162,660 | 164,067 | 149,040 |
| 2000 | 144,473 | 144,643 | 142,434 | 147,822 | 151,032 | 162,533 | 168,825 | 158,961 | 158,574 | 156,673 | 156,428 | 146,924 |
| 2001 | 146,053 | 143,802 | 136,243 | 142,768 | 152,688 | 156,767 | 159,495 | 159,805 | 166,807 | 159,472 | 159,117 | 163,790 |
| 2002 | 163,262 | 160,280 | 154,678 | 160,066 | 162,611 | 164,122 | 165,797 | 164,214 | 166,216 | 152,899 | 150,640 | 149,524 |
| 2003 | 144,075 | 133,592 | 135,590 | 137,085 | 146,621 | 154,373 | 156,583 | 156,493 | 154,245 | 150,221 | 158,215 | 155,061 |
| 2004 | 150,251 | 147,312 | 140,711 | 143,064 | 154,776 | 158,473 | 162,621 | 168,467 | 166,265 | 156,163 | 153,795 | 154,905 |
| 2005 | 156,650 | 157,383 | 149,243 | 153,940 | 160,914 | 157,907 | 164,927 | 161,342 | 156,847 | 153,385 | 158,129 | 152,185 |
| 2006 | 157,142 | 152,482 | 154,724 | 154,209 | 157,904 | 158,616 | 161,805 | 169,064 | 177,102 | 165,587 | 161,162 | 162,417 |
| 2007 | 160,495 | 153,649 | 149,505 | 151,242 | 156,242 | 157,783 | 159,606 | 162,955 | 166,876 | 160,380 | 158,501 | 158,678 |
| 2008 | 155,717 | 153,313 | 145,348 | 148,369 | 157,395 | 161,582 | 161,678 | 165,969 | 163,352 | 155,906 | 158,780 | 154,336 |
| 2009 | 160,107 | 161,995 | 157,618 | 160,858 | 166,866 | 174,355 | 182,346 | 182,275 | 182,855 | 172,542 | 164,246 | 159,290 |
| 2010 | 165,420 | 162,131 | 155,845 | 156,907 | 165,502 | 167,098 | 172,828 | 174,583 | 178,130 | 171,006 | 168,329 | 163,126 |
| 2011 | 166,383 | 158,600 | 154,216 | 155,928 | 160,928 | 166,250 | 175,019 | 173,384 | 179,515 | 175,090 | 174,415 | 175,207 |
| 2012 | 178,584 | 172,496 | 170,015 | 170,102 | 168,832 | 171,437 | 173,964 | 179,601 | 181,004 | 170,728 | 165,745 | 171,458 |
| 2013 | 165,141 | 163,641 | 163,058 | 162,313 | 160,273 | 165,628 | 169,002 | 172,818 | 178,157 | 164,769 | 162,595 | 158,435 |
| 2014 | 156,661 | 157,047 | 153,814 | 161,425 | 167,380 | 175,168 | 178,040 | 182,891 | 184,972 | 171,455 | 170,788 | 178,321 |
| 2015 | 174,786 | 170,259 | 171,758 | 178,583 | 179,723 | 182,870 | 184,337 | 188,131 | 184,858 | 175,194 | 182,814 | 183,669 |
| 2016 | 187,614 | 184,940 | 180,568 | 175,450 | 181,081 | 185,115 | 192,957 | 193,572 | 192,684 | 185,314 | 180,381 | 176,567 |
| 2017 | 180,259 | 180,262 | 173,105 | 178,689 | 180,680 | 180,333 | 187,666 | 190,467 | 188,272 | 178,056 | 173,776 | 174,979 |
| 2018 | 173,663 | 175,237 | 171,272 | 173,850 | 176,662 | 181,467 | 188,604 | 196,175 | 201,853 | 182,933 | 179,655 | 186,299 |
| 2019 | 186,217 | 178,749 | 174,423 | 175,307 | 174,335 | 182,634 | 187,294 | 192,977 | 193,111 | 177,999 | 172,288 | 177,685 |
| 2020 | 178,044 | 176,632 | 176,976 | 177,500 | 185,955 | 183,911 | 189,809 | 192,355 | 186,192 | 177,956 | 176,739 | 168,503 |
| 2021 | 172,999 | 161,305 | 162,863 | 158,439 | 166,610 | 173,936 | 177,598 | 181,261 | 180,329 | 176,911 | 174,761 | 174,531 |
| 2022 | 181,579 | 179,053 | 171,402 | 163,263 | 165,814 | 169,810 | 179,109 | 174,164 | 174,842 | 175,792 | 180,001 | 175,825 |
| 2023 | 177,078 | 174,947 | 168,727 | 167,786 | 169,527 | 173,062 | 186,215 | 190,409 | 189,679 | 180,434 | 178,131 | 183,760 |
| 2024 | 185,031 | |||||||||||
| - = No Data Reported; -- = Not Applicable; NA = Not Available; W = Withheld to avoid disclosure of individual company data. |
| Release Date: 3/29/2024 |
| Next Release Date: 4/30/2024 |