|
Download Data (XLS File) |
|
||||||||
|
||||||||
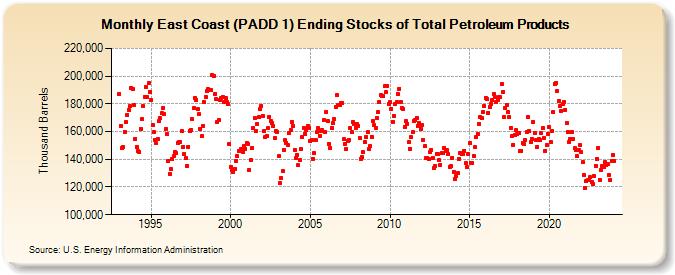
| East Coast (PADD 1) Ending Stocks of Total Petroleum Products (Thousand Barrels) | ||||||||
| Year | Jan | Feb | Mar | Apr | May | Jun | Jul | Aug | Sep | Oct | Nov | Dec |
|---|---|---|---|---|---|---|---|---|---|---|---|---|
| 1993 | 187,114 | 164,226 | 148,274 | 148,946 | 159,727 | 166,797 | 171,983 | 175,610 | 178,123 | 191,484 | 190,616 | 179,216 |
| 1994 | 154,959 | 148,995 | 146,132 | 145,064 | 161,979 | 168,775 | 178,234 | 185,128 | 192,328 | 184,982 | 194,870 | 188,886 |
| 1995 | 182,482 | 164,644 | 159,415 | 153,766 | 151,391 | 154,725 | 167,790 | 169,649 | 173,026 | 177,128 | 172,665 | 161,788 |
| 1996 | 158,174 | 139,034 | 129,731 | 132,708 | 140,499 | 142,169 | 145,385 | 144,412 | 151,988 | 152,417 | 152,444 | 160,326 |
| 1997 | 149,043 | 143,647 | 140,656 | 135,026 | 149,130 | 160,740 | 161,359 | 168,701 | 176,639 | 184,334 | 182,827 | 175,962 |
| 1998 | 172,408 | 161,890 | 156,605 | 164,193 | 180,961 | 185,165 | 189,209 | 190,496 | 190,008 | 189,804 | 200,756 | 200,425 |
| 1999 | 187,438 | 183,295 | 166,979 | 168,075 | 183,120 | 184,093 | 185,138 | 181,416 | 184,499 | 181,366 | 180,190 | 150,668 |
| 2000 | 134,611 | 132,102 | 130,961 | 133,329 | 139,096 | 142,251 | 146,026 | 145,890 | 147,073 | 145,137 | 149,847 | 147,688 |
| 2001 | 151,836 | 150,728 | 132,225 | 139,395 | 148,488 | 162,852 | 169,934 | 160,567 | 165,599 | 170,639 | 175,931 | 178,611 |
| 2002 | 171,431 | 160,577 | 155,825 | 156,620 | 162,364 | 170,700 | 167,781 | 166,356 | 163,901 | 155,239 | 160,399 | 159,643 |
| 2003 | 142,076 | 122,800 | 126,551 | 131,583 | 146,706 | 153,709 | 151,799 | 150,278 | 158,960 | 161,115 | 167,173 | 163,749 |
| 2004 | 146,993 | 140,784 | 143,256 | 135,568 | 139,821 | 147,299 | 156,372 | 162,609 | 158,330 | 161,239 | 163,865 | 162,291 |
| 2005 | 152,992 | 153,874 | 140,386 | 144,199 | 153,763 | 159,341 | 162,382 | 156,972 | 160,729 | 161,026 | 168,243 | 159,895 |
| 2006 | 174,295 | 167,708 | 151,261 | 148,269 | 162,416 | 166,235 | 168,844 | 177,542 | 186,358 | 178,888 | 178,916 | 180,758 |
| 2007 | 180,631 | 154,433 | 151,242 | 147,389 | 153,525 | 153,908 | 162,453 | 159,340 | 166,987 | 165,618 | 162,871 | 165,329 |
| 2008 | 164,340 | 155,465 | 140,516 | 141,378 | 145,004 | 152,528 | 156,230 | 159,793 | 147,269 | 149,318 | 156,359 | 167,370 |
| 2009 | 164,400 | 162,825 | 170,116 | 173,791 | 181,481 | 186,412 | 185,593 | 185,669 | 192,679 | 188,260 | 193,137 | 180,136 |
| 2010 | 180,980 | 176,423 | 167,116 | 171,439 | 179,782 | 181,630 | 186,830 | 191,061 | 181,571 | 177,167 | 176,152 | 163,497 |
| 2011 | 167,370 | 165,713 | 152,116 | 147,646 | 156,233 | 159,542 | 167,353 | 168,270 | 169,806 | 164,083 | 166,349 | 161,864 |
| 2012 | 164,984 | 154,247 | 149,278 | 140,770 | 141,092 | 139,851 | 144,994 | 146,976 | 141,229 | 133,675 | 135,428 | 144,061 |
| 2013 | 143,617 | 139,121 | 136,101 | 144,422 | 144,217 | 148,286 | 146,011 | 146,418 | 143,736 | 134,635 | 134,819 | 140,989 |
| 2014 | 131,149 | 125,907 | 127,753 | 129,811 | 140,304 | 144,613 | 143,768 | 143,964 | 146,257 | 136,962 | 134,129 | 143,956 |
| 2015 | 151,684 | 137,533 | 137,216 | 142,485 | 148,691 | 156,088 | 158,251 | 165,634 | 170,443 | 169,436 | 173,945 | 178,158 |
| 2016 | 184,557 | 183,354 | 173,620 | 177,969 | 180,087 | 182,472 | 187,031 | 184,859 | 181,024 | 182,410 | 184,885 | 184,671 |
| 2017 | 194,460 | 188,591 | 170,335 | 177,286 | 179,194 | 174,093 | 170,259 | 162,911 | 156,494 | 150,595 | 157,364 | 160,806 |
| 2018 | 157,885 | 158,955 | 145,788 | 146,282 | 151,868 | 150,907 | 153,615 | 159,631 | 170,141 | 160,338 | 152,379 | 154,507 |
| 2019 | 166,958 | 158,987 | 153,572 | 149,149 | 154,372 | 153,640 | 158,911 | 162,487 | 155,356 | 146,185 | 150,123 | 158,326 |
| 2020 | 162,996 | 152,648 | 160,484 | 174,049 | 194,420 | 195,246 | 189,573 | 182,193 | 178,398 | 174,805 | 179,960 | 181,194 |
| 2021 | 175,759 | 166,191 | 159,673 | 152,421 | 154,524 | 159,624 | 154,535 | 147,829 | 146,705 | 142,150 | 146,459 | 150,423 |
| 2022 | 144,947 | 137,730 | 128,395 | 119,293 | 124,298 | 124,714 | 125,033 | 126,989 | 123,468 | 122,152 | 127,756 | 135,213 |
| 2023 | 140,365 | 148,430 | 125,219 | 132,137 | 135,190 | 134,276 | 137,933 | 135,573 | 136,477 | 128,593 | 125,123 | 138,677 |
| 2024 | 143,235 | |||||||||||
| - = No Data Reported; -- = Not Applicable; NA = Not Available; W = Withheld to avoid disclosure of individual company data. |
| Release Date: 3/29/2024 |
| Next Release Date: 4/30/2024 |