|
Download Data (XLS File) |
|
||||||||
|
||||||||
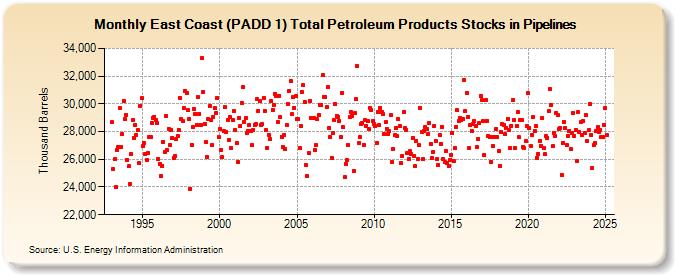
| East Coast (PADD 1) Total Petroleum Products Stocks in Pipelines (Thousand Barrels) | ||||||||
| Year | Jan | Feb | Mar | Apr | May | Jun | Jul | Aug | Sep | Oct | Nov | Dec |
|---|---|---|---|---|---|---|---|---|---|---|---|---|
| 1993 | 28,671 | 25,267 | 25,999 | 23,985 | 26,635 | 26,909 | 29,681 | 26,902 | 27,795 | 30,219 | 28,887 | 29,227 |
| 1994 | 25,933 | 25,485 | 24,226 | 26,396 | 28,814 | 27,561 | 28,498 | 27,780 | 28,103 | 25,711 | 29,858 | 30,388 |
| 1995 | 26,957 | 27,172 | 26,370 | 25,966 | 26,439 | 27,588 | 27,623 | 28,624 | 29,009 | 29,054 | 28,866 | 28,621 |
| 1996 | 26,018 | 25,645 | 24,785 | 25,537 | 27,259 | 26,494 | 29,125 | 26,659 | 28,218 | 27,037 | 28,140 | 27,548 |
| 1997 | 26,099 | 26,235 | 27,436 | 27,665 | 28,100 | 30,454 | 28,887 | 28,729 | 29,690 | 30,942 | 30,770 | 29,539 |
| 1998 | 28,920 | 23,880 | 27,059 | 28,340 | 29,644 | 29,301 | 28,493 | 30,481 | 29,286 | 28,508 | 33,323 | 30,883 |
| 1999 | 28,577 | 27,266 | 26,168 | 28,932 | 29,843 | 28,804 | 27,035 | 29,049 | 29,683 | 29,332 | 30,440 | 27,595 |
| 2000 | 28,186 | 26,665 | 26,131 | 28,007 | 29,756 | 27,976 | 28,834 | 27,402 | 29,049 | 26,792 | 28,850 | 29,472 |
| 2001 | 28,097 | 27,158 | 25,828 | 29,009 | 28,419 | 30,048 | 31,179 | 28,721 | 28,954 | 27,861 | 28,054 | 28,483 |
| 2002 | 28,007 | 27,034 | 28,123 | 28,473 | 28,573 | 30,325 | 29,503 | 30,208 | 28,446 | 28,525 | 30,452 | 29,501 |
| 2003 | 28,102 | 26,820 | 27,780 | 27,436 | 30,183 | 29,574 | 29,898 | 30,730 | 30,587 | 28,687 | 30,595 | 29,057 |
| 2004 | 27,643 | 26,854 | 27,743 | 26,711 | 28,497 | 29,993 | 30,952 | 31,624 | 29,238 | 30,464 | 29,730 | 30,537 |
| 2005 | 28,906 | 28,921 | 26,827 | 28,394 | 30,859 | 31,344 | 30,141 | 25,600 | 24,778 | 26,435 | 30,229 | 29,008 |
| 2006 | 28,974 | 28,969 | 26,688 | 27,014 | 28,882 | 29,190 | 29,951 | 29,951 | 32,077 | 30,509 | 30,514 | 29,739 |
| 2007 | 31,194 | 28,237 | 27,613 | 26,110 | 27,867 | 28,819 | 29,952 | 29,134 | 29,075 | 28,769 | 27,600 | 30,792 |
| 2008 | 28,296 | 24,706 | 25,675 | 25,924 | 27,058 | 29,045 | 29,400 | 29,099 | 25,165 | 29,317 | 30,326 | 32,702 |
| 2009 | 27,174 | 27,610 | 28,537 | 28,641 | 27,056 | 28,831 | 28,409 | 28,743 | 28,152 | 29,724 | 29,570 | 28,765 |
| 2010 | 28,555 | 28,396 | 27,148 | 29,434 | 28,447 | 29,684 | 29,440 | 29,299 | 27,805 | 28,664 | 28,205 | 27,847 |
| 2011 | 28,010 | 29,165 | 25,813 | 26,715 | 27,749 | 28,284 | 27,704 | 28,905 | 28,366 | 25,716 | 26,272 | 29,425 |
| 2012 | 28,255 | 28,147 | 26,439 | 26,049 | 26,572 | 26,410 | 27,559 | 26,266 | 25,482 | 27,346 | 26,030 | 27,011 |
| 2013 | 29,710 | 27,994 | 25,998 | 28,054 | 28,298 | 28,211 | 27,821 | 28,609 | 27,123 | 26,117 | 26,529 | 28,410 |
| 2014 | 27,336 | 25,997 | 25,585 | 27,770 | 27,103 | 28,364 | 26,001 | 25,813 | 26,627 | 25,743 | 25,549 | 25,940 |
| 2015 | 26,303 | 27,871 | 25,845 | 26,778 | 28,329 | 29,527 | 28,784 | 28,948 | 28,802 | 28,905 | 31,723 | 29,479 |
| 2016 | 30,817 | 29,076 | 26,792 | 28,460 | 28,065 | 28,530 | 28,764 | 28,382 | 26,899 | 27,492 | 28,598 | 30,573 |
| 2017 | 30,249 | 28,779 | 26,321 | 30,271 | 28,794 | 27,704 | 27,609 | 25,834 | 27,638 | 26,937 | 27,614 | 28,190 |
| 2018 | 27,572 | 26,623 | 25,543 | 27,963 | 28,515 | 28,487 | 27,818 | 28,282 | 28,938 | 28,085 | 26,808 | 28,427 |
| 2019 | 30,285 | 28,824 | 26,803 | 28,381 | 29,377 | 27,581 | 28,806 | 28,815 | 26,886 | 26,802 | 27,339 | 28,393 |
| 2020 | 30,793 | 28,227 | 26,922 | 27,780 | 29,049 | 28,061 | 28,379 | 26,118 | 26,396 | 27,330 | 26,972 | 28,960 |
| 2021 | 26,839 | 26,349 | 27,644 | 27,536 | 29,482 | 31,047 | 29,899 | 26,931 | 27,917 | 27,670 | 29,354 | 29,209 |
| 2022 | 28,168 | 28,278 | 24,884 | 27,191 | 28,695 | 28,226 | 26,996 | 27,703 | 28,070 | 26,720 | 27,895 | 29,307 |
| 2023 | 27,709 | 28,117 | 25,871 | 29,377 | 27,957 | 28,661 | 27,720 | 28,753 | 27,931 | 29,186 | 27,318 | 28,088 |
| 2024 | 29,966 | 27,741 | ||||||||||
| - = No Data Reported; -- = Not Applicable; NA = Not Available; W = Withheld to avoid disclosure of individual company data. |
| Release Date: 4/30/2024 |
| Next Release Date: 5/31/2024 |