|
Download Data (XLS File) |
|
||||||||
|
||||||||
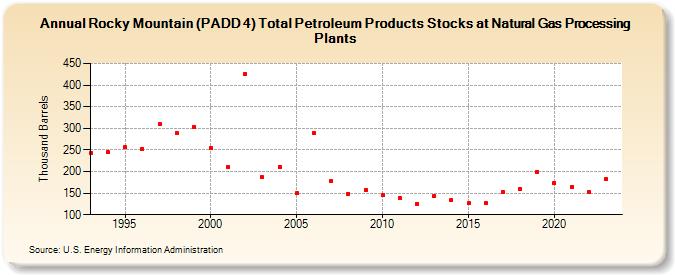
| Rocky Mountain (PADD 4) Total Petroleum Products Stocks at Natural Gas Processing Plants (Thousand Barrels) | ||||||||
| Decade | Year-0 | Year-1 | Year-2 | Year-3 | Year-4 | Year-5 | Year-6 | Year-7 | Year-8 | Year-9 |
|---|---|---|---|---|---|---|---|---|---|---|
| 1990's | 243 | 244 | 256 | 253 | 309 | 290 | 304 | |||
| 2000's | 254 | 211 | 426 | 187 | 211 | 150 | 290 | 178 | 149 | 157 |
| 2010's | 145 | 139 | 125 | 143 | 133 | 126 | 126 | 152 | 160 | 200 |
| 2020's | 173 | 165 | 153 | 196 |
| - = No Data Reported; -- = Not Applicable; NA = Not Available; W = Withheld to avoid disclosure of individual company data. |
| Release Date: 8/30/2024 |
| Next Release Date: 8/29/2025 |