|
Download Data (XLS File) |
|
||||||||
|
||||||||
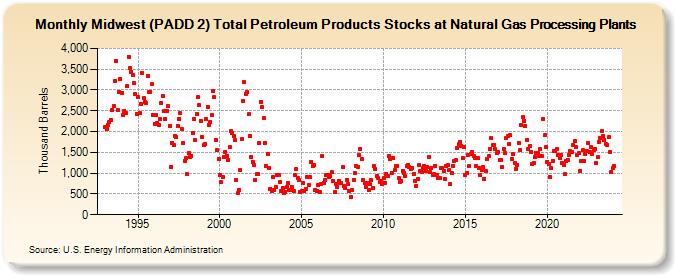
| Midwest (PADD 2) Total Petroleum Products Stocks at Natural Gas Processing Plants (Thousand Barrels) | ||||||||
| Year | Jan | Feb | Mar | Apr | May | Jun | Jul | Aug | Sep | Oct | Nov | Dec |
|---|---|---|---|---|---|---|---|---|---|---|---|---|
| 1993 | 2,107 | 2,058 | 2,152 | 2,219 | 2,276 | 2,515 | 2,612 | 3,222 | 3,707 | 2,520 | 2,960 | 3,273 |
| 1994 | 2,935 | 2,399 | 2,503 | 2,453 | 3,091 | 3,804 | 3,519 | 3,440 | 3,353 | 3,167 | 2,900 | 2,433 |
| 1995 | 2,842 | 2,446 | 2,668 | 3,411 | 2,797 | 2,712 | 2,695 | 3,346 | 2,944 | 2,960 | 3,133 | 2,394 |
| 1996 | 2,183 | 2,406 | 2,194 | 2,166 | 2,297 | 2,689 | 2,857 | 2,499 | 2,296 | 2,489 | 2,608 | 2,133 |
| 1997 | 1,148 | 1,734 | 1,680 | 1,900 | 1,872 | 2,139 | 2,312 | 2,437 | 2,056 | 1,734 | 1,303 | 1,360 |
| 1998 | 973 | 1,482 | 1,387 | 1,413 | 1,973 | 2,299 | 1,797 | 2,431 | 2,820 | 2,628 | 2,263 | 1,865 |
| 1999 | 1,668 | 1,689 | 2,297 | 2,600 | 2,163 | 2,235 | 2,388 | 2,981 | 2,822 | 1,799 | 1,549 | 1,349 |
| 2000 | 949 | 781 | 904 | 1,388 | 1,520 | 1,410 | 1,310 | 1,620 | 2,013 | 1,956 | 1,896 | 1,789 |
| 2001 | 834 | 520 | 595 | 1,074 | 1,809 | 2,727 | 3,183 | 2,915 | 2,945 | 2,414 | 1,904 | 1,393 |
| 2002 | 1,278 | 1,201 | 839 | 969 | 970 | 1,719 | 2,721 | 2,581 | 2,328 | 1,719 | 1,165 | 1,460 |
| 2003 | 1,120 | 627 | 570 | 904 | 601 | 661 | 964 | 956 | 796 | 579 | 652 | 518 |
| 2004 | 544 | 659 | 768 | 589 | 604 | 676 | 580 | 945 | 1,094 | 882 | 831 | 545 |
| 2005 | 568 | 752 | 561 | 625 | 904 | 717 | 897 | 1,277 | 1,174 | 1,186 | 584 | 576 |
| 2006 | 706 | 540 | 736 | 1,406 | 765 | 832 | 955 | 946 | 918 | 927 | 1,019 | 822 |
| 2007 | 540 | 750 | 664 | 817 | 754 | 766 | 1,149 | 693 | 632 | 845 | 735 | 574 |
| 2008 | 425 | 590 | 826 | 1,001 | 1,170 | 1,142 | 1,436 | 1,592 | 1,329 | 828 | 757 | 671 |
| 2009 | 753 | 587 | 731 | 828 | 633 | 1,163 | 1,091 | 927 | 887 | 778 | 802 | 735 |
| 2010 | 871 | 762 | 978 | 925 | 1,410 | 1,332 | 1,013 | 1,363 | 1,065 | 1,161 | 1,161 | 879 |
| 2011 | 791 | 808 | 1,061 | 994 | 928 | 1,171 | 1,199 | 1,139 | 1,108 | 1,135 | 976 | 818 |
| 2012 | 697 | 861 | 1,186 | 1,043 | 1,024 | 1,130 | 1,164 | 1,049 | 1,147 | 1,386 | 1,017 | 1,122 |
| 2013 | 963 | 989 | 1,173 | 959 | 892 | 882 | 1,129 | 1,117 | 1,050 | 870 | 1,161 | 1,196 |
| 2014 | 1,064 | 733 | 1,005 | 1,176 | 1,302 | 1,304 | 1,600 | 1,692 | 1,750 | 1,656 | 1,374 | 1,630 |
| 2015 | 957 | 1,011 | 1,437 | 1,172 | 1,455 | 1,520 | 1,403 | 1,372 | 1,160 | 1,372 | 1,128 | 955 |
| 2016 | 1,077 | 1,142 | 859 | 1,059 | 1,347 | 1,404 | 1,580 | 1,845 | 1,668 | 1,675 | 1,569 | 1,478 |
| 2017 | 1,504 | 1,304 | 1,310 | 1,155 | 1,582 | 1,494 | 1,844 | 1,903 | 1,692 | 1,907 | 1,346 | 1,460 |
| 2018 | 1,235 | 1,107 | 1,197 | 1,736 | 1,552 | 2,148 | 2,345 | 2,256 | 2,131 | 1,793 | 1,576 | 1,645 |
| 2019 | 1,515 | 1,222 | 1,240 | 1,386 | 1,486 | 1,473 | 1,424 | 1,575 | 1,405 | 2,306 | 1,908 | 1,620 |
| 2020 | 1,274 | 1,217 | 909 | 1,129 | 1,290 | 1,537 | 1,524 | 1,575 | 1,437 | 1,363 | 1,448 | 1,250 |
| 2021 | 1,199 | 974 | 1,285 | 1,325 | 1,444 | 1,524 | 1,505 | 1,670 | 1,762 | 1,621 | 1,443 | 1,481 |
| 2022 | 1,054 | 1,294 | 1,545 | 1,281 | 1,453 | 1,533 | 1,724 | 1,499 | 1,621 | 1,465 | 1,546 | 1,590 |
| 2023 | 1,247 | 1,391 | 1,752 | 1,851 | 2,003 | 1,898 | 1,805 | 1,703 | 1,679 | 1,858 | 1,513 | 1,022 |
| 2024 | 1,120 | |||||||||||
| - = No Data Reported; -- = Not Applicable; NA = Not Available; W = Withheld to avoid disclosure of individual company data. |
| Release Date: 3/29/2024 |
| Next Release Date: 4/30/2024 |