|
Download Data (XLS File) |
|
||||||||
|
||||||||
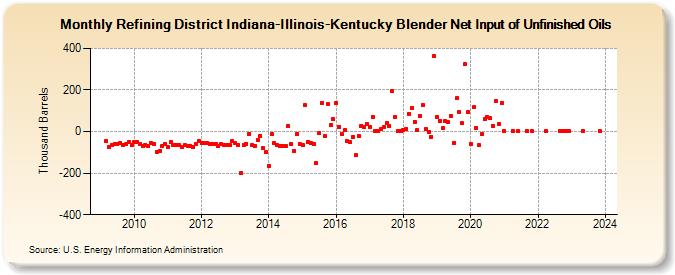
| Refining District Indiana-Illinois-Kentucky Blender Net Input of Unfinished Oils (Thousand Barrels) | ||||||||
| Year | Jan | Feb | Mar | Apr | May | Jun | Jul | Aug | Sep | Oct | Nov | Dec |
|---|---|---|---|---|---|---|---|---|---|---|---|---|
| 2009 | -47 | -73 | -65 | -60 | -61 | -55 | -64 | -62 | -52 | -67 | ||
| 2010 | -48 | -50 | -59 | -70 | -63 | -68 | -57 | -59 | -97 | -92 | -70 | -61 |
| 2011 | -72 | -51 | -64 | -65 | -64 | -72 | -66 | -71 | -69 | -75 | -58 | -46 |
| 2012 | -57 | -57 | -55 | -61 | -60 | -58 | -71 | -58 | -67 | -65 | -65 | -46 |
| 2013 | -54 | -64 | -201 | -64 | -58 | -12 | -66 | -69 | -42 | -21 | -80 | -99 |
| 2014 | -165 | -14 | -55 | -66 | -68 | -71 | -71 | 26 | -60 | -92 | -14 | -61 |
| 2015 | -64 | 126 | -49 | -56 | -61 | -152 | -7 | 139 | -22 | 131 | 31 | 59 |
| 2016 | 135 | 21 | -11 | 7 | -47 | -52 | -25 | -114 | -21 | 29 | 22 | 38 |
| 2017 | 22 | 70 | 4 | 5 | 11 | 21 | 39 | 29 | 195 | 69 | 2 | 2 |
| 2018 | 8 | 12 | 85 | 115 | 48 | 6 | 76 | 127 | 12 | 0 | -24 | 361 |
| 2019 | 69 | 53 | 15 | 50 | 45 | 76 | -53 | 159 | 93 | 39 | 323 | 93 |
| 2020 | -60 | 116 | 19 | -66 | -12 | 59 | 70 | 63 | 28 | 148 | 37 | 137 |
| 2021 | 1 | 3 | 1 | 2 | 1 | |||||||
| 2022 | 2 | 4 | 3 | 4 | 1 | |||||||
| 2023 | 5 | 1 | ||||||||||
| - = No Data Reported; -- = Not Applicable; NA = Not Available; W = Withheld to avoid disclosure of individual company data. |
| Release Date: 3/29/2024 |
| Next Release Date: 4/30/2024 |