|
Download Data (XLS File) |
|
||||||||
|
||||||||
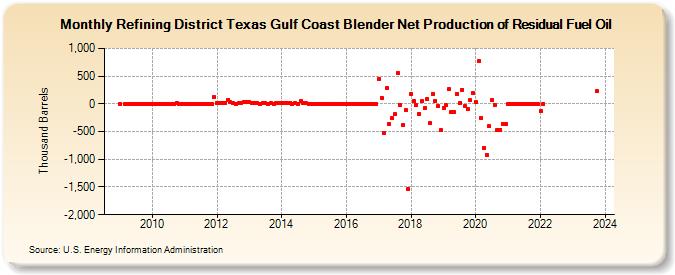
| Refining District Texas Gulf Coast Blender Net Production of Residual Fuel Oil (Thousand Barrels) | ||||||||
| Year | Jan | Feb | Mar | Apr | May | Jun | Jul | Aug | Sep | Oct | Nov | Dec |
|---|---|---|---|---|---|---|---|---|---|---|---|---|
| 2009 | 0 | 0 | 0 | 1 | 0 | 0 | 0 | 0 | 0 | 0 | 0 | |
| 2010 | 0 | 0 | 0 | 0 | 0 | 0 | 0 | 0 | 0 | 19 | 0 | 0 |
| 2011 | 0 | 0 | 0 | 0 | 0 | 0 | 0 | 0 | 0 | 0 | 0 | 124 |
| 2012 | 20 | 16 | 23 | 13 | 75 | 26 | 8 | 5 | 9 | 22 | 29 | 27 |
| 2013 | 32 | 6 | 12 | 16 | 4 | 12 | 10 | 4 | 10 | 4 | 8 | 10 |
| 2014 | 24 | 8 | 10 | 22 | 2 | 10 | 4 | 45 | 21 | 6 | 1 | 1 |
| 2015 | 1 | 0 | 0 | 0 | 0 | 0 | 0 | 0 | 0 | 0 | 0 | 0 |
| 2016 | 0 | 0 | 0 | 0 | 0 | 0 | 0 | 0 | 0 | 0 | 0 | 0 |
| 2017 | 445 | 112 | -519 | 289 | -366 | -264 | -190 | 560 | -16 | -382 | -116 | -1,535 |
| 2018 | 179 | 43 | -26 | -177 | 43 | -77 | 86 | -349 | 178 | 55 | -36 | -478 |
| 2019 | -68 | -30 | 259 | -146 | -142 | 184 | 11 | 257 | -48 | -92 | 64 | 187 |
| 2020 | 32 | 767 | -253 | -788 | -918 | -407 | 65 | -25 | -477 | -465 | -363 | -365 |
| 2021 | 0 | 0 | 0 | 0 | 0 | 0 | 0 | 0 | 0 | 0 | 0 | 0 |
| 2022 | -133 | 0 | ||||||||||
| 2023 | 229 | |||||||||||
| - = No Data Reported; -- = Not Applicable; NA = Not Available; W = Withheld to avoid disclosure of individual company data. |
| Release Date: 3/29/2024 |
| Next Release Date: 4/30/2024 |