|
Download Data (XLS File) |
|
||||||||
|
||||||||
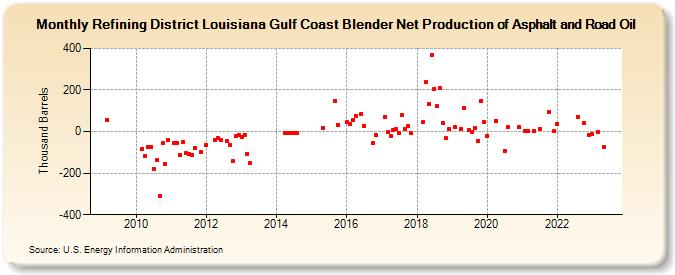
| Refining District Louisiana Gulf Coast Blender Net Production of Asphalt and Road Oil (Thousand Barrels) | ||||||||
| Year | Jan | Feb | Mar | Apr | May | Jun | Jul | Aug | Sep | Oct | Nov | Dec |
|---|---|---|---|---|---|---|---|---|---|---|---|---|
| 2009 | 57 | |||||||||||
| 2010 | -82 | -118 | -74 | -74 | -178 | -139 | -312 | -56 | -157 | -40 | ||
| 2011 | -55 | -57 | -113 | -50 | -105 | -110 | -114 | -78 | -97 | |||
| 2012 | -65 | -41 | -31 | -40 | -47 | -63 | -143 | -23 | -15 | |||
| 2013 | -24 | -15 | -107 | -150 | ||||||||
| 2014 | -9 | -9 | -8 | -8 | -9 | |||||||
| 2015 | 19 | 149 | 32 | |||||||||
| 2016 | 44 | 36 | 54 | 77 | 85 | 28 | -54 | -18 | ||||
| 2017 | 71 | -1 | -21 | 6 | 12 | -8 | 78 | 13 | 25 | -7 | ||
| 2018 | 44 | 238 | 131 | 366 | 207 | 122 | 208 | 43 | -33 | 14 | ||
| 2019 | 21 | 12 | 114 | 6 | -1 | 16 | -46 | 148 | 47 | |||
| 2020 | -19 | 53 | -93 | 20 | 21 | |||||||
| 2021 | 3 | 2 | 1 | 14 | 93 | 1 | ||||||
| 2022 | 38 | 72 | 41 | -17 | ||||||||
| 2023 | -14 | -1 | -72 | |||||||||
| - = No Data Reported; -- = Not Applicable; NA = Not Available; W = Withheld to avoid disclosure of individual company data. |
| Release Date: 8/30/2024 |
| Next Release Date: 9/30/2024 |