|
Download Data (XLS File) |
|
||||||||
|
||||||||
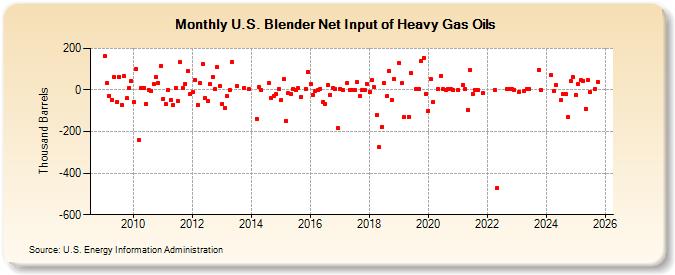
| U.S. Blender Net Input of Heavy Gas Oils (Thousand Barrels) | ||||||||
| Year | Jan | Feb | Mar | Apr | May | Jun | Jul | Aug | Sep | Oct | Nov | Dec |
|---|---|---|---|---|---|---|---|---|---|---|---|---|
| 2009 | 161 | 34 | -27 | -47 | 62 | -59 | 64 | -72 | 67 | -41 | 11 | 44 |
| 2010 | -58 | 101 | -241 | 10 | 10 | -66 | 2 | -3 | 27 | 60 | 35 | 116 |
| 2011 | -42 | -69 | 1 | -47 | -72 | 11 | -54 | 133 | 10 | 31 | 89 | -19 |
| 2012 | -12 | 49 | -73 | 32 | 126 | -38 | -51 | 27 | 63 | 3 | 109 | 19 |
| 2013 | -66 | -87 | -28 | -1 | 135 | 17 | 9 | 3 | ||||
| 2014 | -138 | 13 | -1 | 35 | -37 | -27 | -20 | 5 | ||||
| 2015 | -50 | 51 | -147 | -16 | -18 | 5 | -2 | 8 | -33 | 7 | 87 | |
| 2016 | 27 | -24 | -3 | 1 | 6 | -56 | -67 | 22 | -22 | 9 | 5 | -183 |
| 2017 | 5 | 2 | 35 | 1 | 1 | -2 | 36 | -30 | 1 | 0 | 29 | |
| 2018 | -9 | 46 | 13 | -118 | -275 | -178 | 32 | -31 | 91 | -46 | 52 | |
| 2019 | 130 | 33 | -131 | -128 | 82 | 4 | 7 | 137 | 155 | -17 | ||
| 2020 | -99 | 51 | -58 | 4 | 69 | 5 | 1 | 4 | 4 | 1 | ||
| 2021 | 2 | 25 | 3 | -95 | 97 | -17 | 2 | 2 | -14 | |||
| 2022 | 2 | -473 | 4 | 3 | 4 | 1 | ||||||
| 2023 | -9 | -5 | 5 | 7 | 97 | 1 | ||||||
| - = No Data Reported; -- = Not Applicable; NA = Not Available; W = Withheld to avoid disclosure of individual company data. |
| Release Date: 4/30/2024 |
| Next Release Date: 5/31/2024 |