|
Download Data (XLS File) |
|
||||||||
|
||||||||
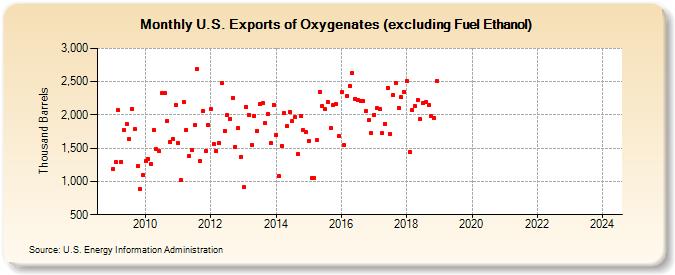
| U.S. Exports of Oxygenates (excluding Fuel Ethanol) (Thousand Barrels) | ||||||||
| Year | Jan | Feb | Mar | Apr | May | Jun | Jul | Aug | Sep | Oct | Nov | Dec |
|---|---|---|---|---|---|---|---|---|---|---|---|---|
| 2009 | 1,184 | 1,293 | 2,067 | 1,298 | 1,773 | 1,860 | 1,639 | 2,096 | 1,789 | 1,231 | 890 | 1,096 |
| 2010 | 1,304 | 1,342 | 1,260 | 1,778 | 1,486 | 1,454 | 2,322 | 2,333 | 1,910 | 1,589 | 1,642 | 2,150 |
| 2011 | 1,578 | 1,021 | 2,198 | 1,780 | 1,382 | 1,480 | 1,847 | 2,684 | 1,302 | 2,052 | 1,455 | 1,855 |
| 2012 | 2,084 | 1,558 | 1,451 | 1,575 | 2,474 | 1,755 | 1,997 | 1,943 | 2,261 | 1,524 | 1,806 | 1,368 |
| 2013 | 911 | 2,121 | 2,006 | 1,552 | 1,989 | 1,763 | 2,165 | 2,179 | 1,876 | 2,021 | 1,573 | 2,154 |
| 2014 | 1,700 | 1,077 | 1,540 | 2,024 | 1,827 | 2,044 | 1,903 | 1,966 | 1,416 | 1,991 | 1,768 | 1,738 |
| 2015 | 1,609 | 1,054 | 1,053 | 1,618 | 2,352 | 2,133 | 2,091 | 2,199 | 1,802 | 2,142 | 2,160 | 1,682 |
| 2016 | 2,338 | 1,543 | 2,288 | 2,441 | 2,631 | 2,241 | 2,223 | 2,215 | 2,202 | 2,056 | 1,917 | 1,726 |
| 2017 | 2,003 | 2,098 | 2,082 | 1,721 | 1,870 | 2,411 | 1,716 | 2,300 | 2,487 | 2,110 | 2,266 | 2,351 |
| 2018 | 2,507 | 1,446 | 2,073 | 2,135 | 2,220 | 1,936 | 2,176 | 2,190 | 2,151 | 1,980 | 1,957 | 2,512 |
| 2019 | -- | -- | -- | -- | -- | -- | -- | -- | -- | -- | -- | -- |
| 2020 | -- | -- | -- | -- | -- | -- | -- | -- | -- | -- | -- | -- |
| 2021 | -- | -- | -- | -- | -- | -- | -- | -- | -- | -- | -- | |
| 2022 | -- | -- | -- | -- | -- | -- | -- | -- | -- | -- | -- | -- |
| 2023 | -- | -- | -- | -- | -- | -- | -- | -- | -- | -- | -- | -- |
| 2024 | -- | |||||||||||
| - = No Data Reported; -- = Not Applicable; NA = Not Available; W = Withheld to avoid disclosure of individual company data. |
| Release Date: 3/29/2024 |
| Next Release Date: 4/30/2024 |