|
Download Data (XLS File) |
|
||||||||
|
||||||||
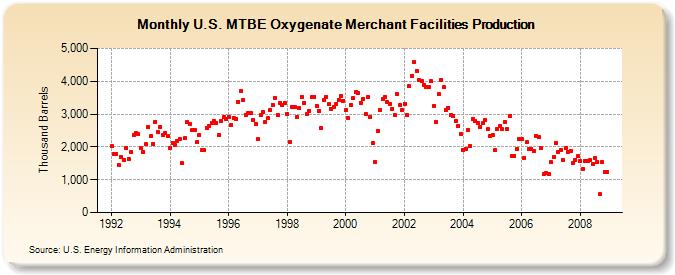
| U.S. MTBE Oxygenate Merchant Facilities Production (Thousand Barrels) | ||||||||
| Year | Jan | Feb | Mar | Apr | May | Jun | Jul | Aug | Sep | Oct | Nov | Dec |
|---|---|---|---|---|---|---|---|---|---|---|---|---|
| 1992 | 2,015 | 1,798 | 1,798 | 1,440 | 1,705 | 1,590 | 1,953 | 1,643 | 1,830 | 2,356 | 2,430 | 2,387 |
| 1993 | 1,953 | 1,848 | 2,077 | 2,610 | 2,325 | 2,100 | 2,759 | 2,449 | 2,610 | 2,356 | 2,430 | 2,325 |
| 1994 | 1,953 | 2,128 | 2,046 | 2,190 | 2,232 | 1,500 | 2,263 | 2,759 | 2,700 | 2,511 | 2,520 | 2,139 |
| 1995 | 2,356 | 1,904 | 1,891 | 2,580 | 2,635 | 2,730 | 2,790 | 2,728 | 2,370 | 2,790 | 2,910 | 2,852 |
| 1996 | 2,914 | 2,668 | 2,883 | 2,850 | 3,379 | 3,690 | 3,441 | 2,976 | 3,030 | 3,038 | 2,820 | 2,697 |
| 1997 | 2,232 | 2,968 | 3,069 | 2,760 | 2,883 | 3,120 | 3,286 | 3,503 | 2,970 | 3,348 | 3,270 | 3,348 |
| 1998 | 3,007 | 2,156 | 3,224 | 3,210 | 2,914 | 3,180 | 3,534 | 3,348 | 3,000 | 3,100 | 3,510 | 3,534 |
| 1999 | 3,255 | 3,108 | 2,573 | 3,420 | 3,534 | 3,300 | 3,162 | 3,224 | 3,300 | 3,441 | 3,540 | 3,410 |
| 2000 | 3,131 | 2,871 | 3,286 | 3,480 | 3,658 | 3,630 | 3,348 | 3,472 | 3,000 | 3,534 | 2,910 | 2,108 |
| 2001 | 1,550 | 2,492 | 3,131 | 3,450 | 3,534 | 3,360 | 3,317 | 3,162 | 2,970 | 3,596 | 3,270 | 3,131 |
| 2002 | 3,317 | 2,968 | 3,844 | 4,170 | 4,588 | 4,320 | 4,030 | 3,999 | 3,900 | 3,813 | 3,810 | 3,999 |
| 2003 | 3,255 | 2,772 | 3,596 | 4,050 | 3,813 | 3,120 | 3,193 | 2,976 | 2,940 | 2,790 | 2,640 | 2,387 |
| 2004 | 1,918 | 1,944 | 2,517 | 2,022 | 2,854 | 2,775 | 2,736 | 2,601 | 2,732 | 2,819 | 2,536 | 2,324 |
| 2005 | 2,356 | 1,891 | 2,557 | 2,623 | 2,532 | 2,771 | 2,531 | 2,940 | 1,726 | 1,718 | 1,930 | 2,229 |
| 2006 | 2,242 | 1,659 | 2,140 | 1,925 | 1,931 | 1,881 | 2,341 | 2,292 | 1,965 | 1,171 | 1,190 | 1,181 |
| 2007 | 1,529 | 1,692 | 2,123 | 1,849 | 1,920 | 1,595 | 1,980 | 1,833 | 1,877 | 1,509 | 1,611 | 1,708 |
| 2008 | 1,574 | 1,329 | 1,566 | 1,584 | 1,598 | 1,468 | 1,652 | 1,546 | 562 | 1,536 | 1,233 | 1,238 |
| - = No Data Reported; -- = Not Applicable; NA = Not Available; W = Withheld to avoid disclosure of individual company data. |
| Release Date: 3/29/2024 |
| Next Release Date: 4/30/2024 |