|
Download Data (XLS File) |
|
||||||||
|
||||||||
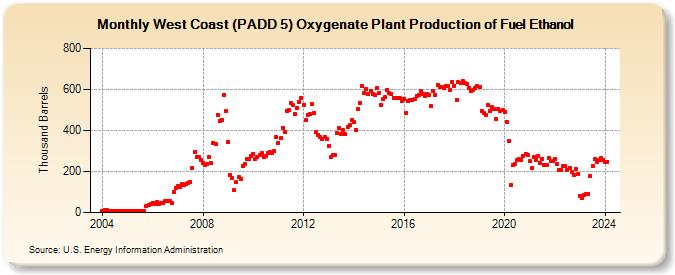
| West Coast (PADD 5) Oxygenate Plant Production of Fuel Ethanol (Thousand Barrels) | ||||||||
| Year | Jan | Feb | Mar | Apr | May | Jun | Jul | Aug | Sep | Oct | Nov | Dec |
|---|---|---|---|---|---|---|---|---|---|---|---|---|
| 2004 | 10 | 11 | 12 | 9 | 10 | 9 | 9 | 8 | 8 | 9 | 8 | 9 |
| 2005 | 8 | 9 | 9 | 8 | 9 | 7 | 9 | 8 | 8 | 32 | 35 | 42 |
| 2006 | 48 | 40 | 50 | 43 | 45 | 49 | 55 | 56 | 55 | 49 | 98 | 120 |
| 2007 | 127 | 124 | 138 | 132 | 141 | 144 | 150 | 219 | 294 | 273 | 271 | 258 |
| 2008 | 243 | 234 | 236 | 272 | 241 | 339 | 335 | 477 | 448 | 453 | 572 | 493 |
| 2009 | 344 | 185 | 169 | 108 | 147 | 171 | 163 | 227 | 237 | 262 | 259 | 277 |
| 2010 | 286 | 260 | 270 | 281 | 291 | 269 | 274 | 290 | 297 | 291 | 298 | 368 |
| 2011 | 339 | 361 | 414 | 393 | 496 | 500 | 534 | 524 | 479 | 509 | 540 | 560 |
| 2012 | 526 | 449 | 477 | 482 | 530 | 486 | 391 | 380 | 370 | 357 | 366 | 359 |
| 2013 | 324 | 269 | 281 | 282 | 387 | 413 | 384 | 400 | 381 | 417 | 428 | 449 |
| 2014 | 439 | 404 | 505 | 533 | 619 | 585 | 600 | 576 | 593 | 580 | 572 | 605 |
| 2015 | 583 | 526 | 551 | 561 | 595 | 583 | 578 | 560 | 557 | 556 | 557 | 544 |
| 2016 | 555 | 486 | 542 | 550 | 550 | 555 | 570 | 572 | 594 | 578 | 567 | 580 |
| 2017 | 572 | 517 | 591 | 573 | 623 | 613 | 612 | 609 | 617 | 615 | 598 | 636 |
| 2018 | 618 | 548 | 636 | 633 | 643 | 629 | 625 | 607 | 592 | 596 | 606 | 615 |
| 2019 | 610 | 495 | 487 | 476 | 526 | 493 | 512 | 503 | 457 | 505 | 494 | 498 |
| 2020 | 490 | 443 | 349 | 136 | 230 | 237 | 257 | 259 | 258 | 274 | 287 | 279 |
| 2021 | 253 | 219 | 272 | 257 | 276 | 240 | 262 | 230 | 234 | 266 | 251 | 251 |
| 2022 | 261 | 235 | 209 | 207 | 226 | 228 | 209 | 216 | 198 | 185 | 212 | 187 |
| 2023 | 82 | 72 | 86 | 91 | 91 | 180 | 229 | 260 | 246 | 255 | 265 | 257 |
| 2024 | 248 | |||||||||||
| - = No Data Reported; -- = Not Applicable; NA = Not Available; W = Withheld to avoid disclosure of individual company data. |
| Release Date: 3/29/2024 |
| Next Release Date: 4/30/2024 |