|
Download Data (XLS File) |
|
||||||||
|
||||||||
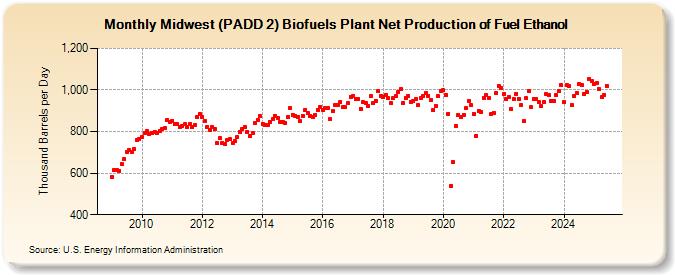
| Midwest (PADD 2) Biofuels Plant Net Production of Fuel Ethanol (Thousand Barrels per Day) | ||||||||
| Year | Jan | Feb | Mar | Apr | May | Jun | Jul | Aug | Sep | Oct | Nov | Dec |
|---|---|---|---|---|---|---|---|---|---|---|---|---|
| 2009 | 583 | 613 | 613 | 612 | 643 | 669 | 703 | 709 | 703 | 715 | 760 | 765 |
| 2010 | 774 | 794 | 801 | 789 | 791 | 798 | 794 | 804 | 811 | 817 | 857 | 847 |
| 2011 | 852 | 838 | 837 | 820 | 828 | 835 | 822 | 835 | 821 | 833 | 870 | 885 |
| 2012 | 868 | 851 | 822 | 808 | 821 | 811 | 744 | 768 | 745 | 742 | 760 | 762 |
| 2013 | 747 | 753 | 773 | 800 | 813 | 823 | 800 | 779 | 794 | 840 | 857 | 874 |
| 2014 | 838 | 831 | 831 | 846 | 858 | 876 | 866 | 847 | 845 | 843 | 872 | 911 |
| 2015 | 881 | 877 | 870 | 849 | 877 | 906 | 889 | 876 | 871 | 882 | 906 | 920 |
| 2016 | 902 | 912 | 914 | 858 | 898 | 928 | 927 | 941 | 917 | 916 | 935 | 968 |
| 2017 | 972 | 958 | 957 | 909 | 942 | 938 | 925 | 969 | 935 | 949 | 996 | 973 |
| 2018 | 964 | 977 | 959 | 937 | 960 | 972 | 988 | 1,005 | 939 | 963 | 971 | 943 |
| 2019 | 948 | 955 | 926 | 961 | 972 | 985 | 972 | 952 | 903 | 924 | 969 | 995 |
| 2020 | 998 | 977 | 885 | 537 | 652 | 828 | 880 | 872 | 882 | 912 | 948 | 926 |
| 2021 | 886 | 781 | 900 | 893 | 963 | 976 | 962 | 886 | 891 | 986 | 1,021 | 1,010 |
| 2022 | 981 | 955 | 965 | 909 | 955 | 983 | 958 | 928 | 851 | 959 | 994 | 916 |
| 2023 | 955 | 955 | 942 | 921 | 944 | 980 | 975 | 948 | 948 | 974 | 995 | 1,023 |
| 2024 | 938 | 1,019 | 1,014 | 923 | 969 | 981 | ||||||
| - = No Data Reported; -- = Not Applicable; NA = Not Available; W = Withheld to avoid disclosure of individual company data. |
| Release Date: 8/30/2024 |
| Next Release Date: 9/30/2024 |