|
Download Data (XLS File) |
|
||||||||
|
||||||||
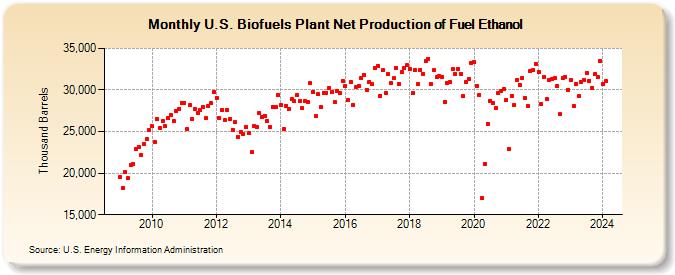
| U.S. Biofuels Plant Net Production of Fuel Ethanol (Thousand Barrels) | ||||||||
| Year | Jan | Feb | Mar | Apr | May | Jun | Jul | Aug | Sep | Oct | Nov | Dec |
|---|---|---|---|---|---|---|---|---|---|---|---|---|
| 2009 | 19,561 | 18,255 | 20,121 | 19,374 | 21,024 | 21,125 | 22,887 | 23,136 | 22,218 | 23,467 | 24,122 | 25,134 |
| 2010 | 25,625 | 23,802 | 26,486 | 25,384 | 26,244 | 25,632 | 26,584 | 26,964 | 26,221 | 27,471 | 27,747 | 28,457 |
| 2011 | 28,467 | 25,300 | 28,178 | 26,538 | 27,720 | 27,224 | 27,541 | 27,976 | 26,588 | 28,013 | 28,383 | 29,718 |
| 2012 | 29,038 | 26,647 | 27,548 | 26,346 | 27,616 | 26,513 | 25,236 | 26,092 | 24,376 | 24,976 | 24,744 | 25,582 |
| 2013 | 24,778 | 22,494 | 25,620 | 25,601 | 27,197 | 26,722 | 26,923 | 26,279 | 25,564 | 27,995 | 27,915 | 29,405 |
| 2014 | 28,194 | 25,269 | 28,120 | 27,733 | 28,888 | 28,629 | 29,413 | 28,665 | 27,807 | 28,644 | 28,588 | 30,831 |
| 2015 | 29,770 | 26,814 | 29,485 | 27,910 | 29,666 | 29,684 | 30,249 | 29,762 | 28,571 | 29,886 | 29,675 | 31,081 |
| 2016 | 30,452 | 28,810 | 30,957 | 28,208 | 30,346 | 30,443 | 31,469 | 31,856 | 30,048 | 31,006 | 30,706 | 32,680 |
| 2017 | 32,887 | 29,307 | 32,393 | 29,639 | 31,863 | 30,794 | 31,384 | 32,672 | 30,701 | 32,212 | 32,631 | 32,952 |
| 2018 | 32,577 | 29,674 | 32,390 | 30,680 | 32,389 | 31,924 | 33,430 | 33,773 | 30,667 | 32,358 | 31,529 | 31,736 |
| 2019 | 31,603 | 28,599 | 30,863 | 30,981 | 32,466 | 31,898 | 32,541 | 31,921 | 29,232 | 30,941 | 31,358 | 33,275 |
| 2020 | 33,346 | 30,511 | 29,409 | 17,003 | 21,157 | 25,959 | 28,708 | 28,420 | 27,779 | 29,614 | 29,915 | 30,108 |
| 2021 | 28,809 | 22,895 | 29,327 | 28,213 | 31,224 | 30,641 | 31,449 | 29,087 | 28,080 | 32,276 | 32,383 | 33,132 |
| 2022 | 32,191 | 28,304 | 31,581 | 28,956 | 31,256 | 31,288 | 31,498 | 30,520 | 27,072 | 31,440 | 31,580 | 30,046 |
| 2023 | 31,189 | 28,089 | 30,753 | 29,236 | 31,016 | 31,146 | 32,024 | 31,137 | 30,290 | 31,870 | 31,609 | 33,534 |
| 2024 | 30,672 | |||||||||||
| - = No Data Reported; -- = Not Applicable; NA = Not Available; W = Withheld to avoid disclosure of individual company data. |
| Release Date: 3/29/2024 |
| Next Release Date: 4/30/2024 |
Referring Pages: