|
Download Data (XLS File) |
|
||||||||
|
||||||||
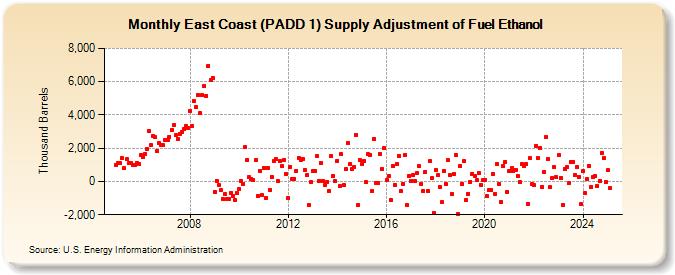
| East Coast (PADD 1) Supply Adjustment of Fuel Ethanol (Thousand Barrels) | ||||||||
| Year | Jan | Feb | Mar | Apr | May | Jun | Jul | Aug | Sep | Oct | Nov | Dec |
|---|---|---|---|---|---|---|---|---|---|---|---|---|
| 2005 | 974 | 1,095 | 1,080 | 1,394 | 779 | 1,321 | 1,097 | 1,133 | 959 | 984 | 1,121 | 1,076 |
| 2006 | 1,578 | 1,441 | 1,670 | 1,961 | 3,015 | 2,165 | 2,730 | 2,645 | 1,816 | 2,288 | 2,190 | 2,175 |
| 2007 | 2,503 | 2,483 | 2,698 | 3,113 | 3,383 | 2,768 | 2,579 | 2,867 | 2,987 | 3,142 | 3,363 | 3,239 |
| 2008 | 4,232 | 3,345 | 4,814 | 4,454 | 5,189 | 4,106 | 5,174 | 5,751 | 5,154 | 6,963 | 6,074 | 6,231 |
| 2009 | -618 | 45 | -189 | -542 | -1,068 | -746 | -1,057 | -1,084 | -684 | -879 | -1,117 | -711 |
| 2010 | -469 | 27 | -147 | 2,064 | 1,295 | 249 | 175 | 67 | 1,263 | -855 | 646 | -828 |
| 2011 | 816 | -973 | 798 | -506 | 256 | 1,239 | 1,344 | 13 | 1,247 | 934 | 1,293 | 472 |
| 2012 | -973 | 888 | 167 | 162 | 646 | 1,429 | 1,285 | 1,371 | 690 | 363 | -1,426 | -57 |
| 2013 | 628 | 657 | 1,503 | 51 | 1,119 | 24 | -188 | -9 | -604 | 1,527 | 351 | -3 |
| 2014 | 1,255 | -261 | 1,635 | -209 | 733 | 2,310 | 1,042 | 739 | 875 | 2,817 | -1,428 | 1,286 |
| 2015 | 1,041 | 1,225 | -57 | 1,623 | 1,617 | -578 | 2,565 | -106 | -75 | 1,658 | 744 | 1,988 |
| 2016 | 87 | 344 | -1,090 | 942 | -208 | 1,066 | 1,559 | -561 | -151 | 1,608 | -1,434 | 331 |
| 2017 | 21 | 390 | 37 | 488 | 900 | -181 | -572 | 584 | -545 | 1,209 | 180 | -1,868 |
| 2018 | 667 | 371 | -346 | -1,256 | 637 | -153 | 1,263 | 377 | -755 | 449 | 1,590 | -1,935 |
| 2019 | 925 | -134 | 1,202 | -1,102 | -737 | -9 | 474 | 349 | 66 | 505 | -189 | 58 |
| 2020 | 97 | -895 | -544 | -521 | 444 | -751 | 1,046 | -126 | -1,243 | 941 | 1,179 | -619 |
| 2021 | 646 | 789 | 646 | 706 | 313 | -35 | 1,039 | 954 | 1,053 | -1,347 | 1,385 | -160 |
| 2022 | -236 | 2,151 | 1,421 | 2,008 | -309 | 581 | 2,681 | 1,338 | -344 | 216 | 853 | 266 |
| 2023 | 1,550 | 237 | -1,371 | 789 | 867 | -135 | 1,171 | 1,230 | 399 | 862 | 323 | -1,066 |
| 2024 | 343 | |||||||||||
| - = No Data Reported; -- = Not Applicable; NA = Not Available; W = Withheld to avoid disclosure of individual company data. |
| Release Date: 3/29/2024 |
| Next Release Date: 4/30/2024 |