|
Download Data (XLS File) |
|
||||||||
|
||||||||
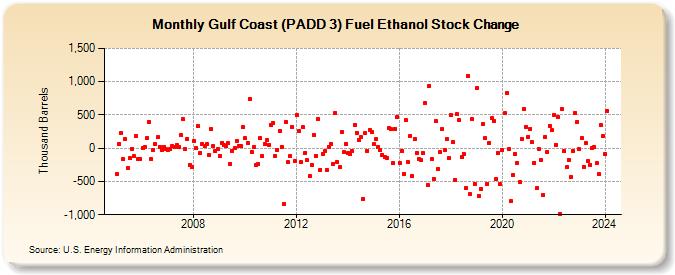
| Gulf Coast (PADD 3) Fuel Ethanol Stock Change (Thousand Barrels) | ||||||||
| Year | Jan | Feb | Mar | Apr | May | Jun | Jul | Aug | Sep | Oct | Nov | Dec |
|---|---|---|---|---|---|---|---|---|---|---|---|---|
| 2005 | -393 | 63 | 222 | -169 | 134 | -303 | -153 | -7 | -123 | 177 | -168 | -157 |
| 2006 | 4 | 18 | 149 | 398 | -164 | -23 | 60 | 166 | 25 | -33 | 18 | -17 |
| 2007 | -22 | -14 | 35 | 11 | 52 | 12 | 194 | 433 | -10 | 144 | -256 | -284 |
| 2008 | 109 | -2 | 331 | -67 | 61 | 34 | 58 | -95 | 287 | 30 | -49 | -10 |
| 2009 | -111 | 85 | 44 | 33 | 75 | -232 | -37 | 10 | 109 | 40 | 26 | 312 |
| 2010 | 148 | 76 | 742 | -53 | 17 | -259 | -240 | 149 | -124 | 65 | 117 | 53 |
| 2011 | 342 | 378 | -115 | -29 | 257 | 19 | -844 | 398 | -213 | -118 | 320 | -191 |
| 2012 | 505 | 252 | -212 | 312 | -66 | -184 | -420 | -253 | 202 | -111 | 435 | -322 |
| 2013 | -84 | -49 | -326 | 25 | 63 | -232 | 530 | -210 | -290 | 248 | -60 | 70 |
| 2014 | -72 | -88 | -48 | 355 | 235 | 127 | 166 | -757 | 222 | -36 | 272 | 248 |
| 2015 | 60 | 132 | 18 | -34 | -96 | -129 | -147 | 305 | 288 | -229 | 288 | 476 |
| 2016 | -216 | -38 | -383 | 425 | -214 | 189 | -419 | 131 | -72 | -163 | -185 | -75 |
| 2017 | 674 | -550 | 937 | -158 | -456 | 406 | -312 | -58 | 287 | -31 | 136 | -149 |
| 2018 | 495 | 91 | -472 | 508 | 417 | -138 | -86 | -601 | 1,084 | -695 | 433 | -534 |
| 2019 | 902 | -719 | -613 | 363 | 146 | -534 | 78 | 452 | 409 | -464 | -69 | -541 |
| 2020 | -24 | 522 | 828 | -12 | -799 | -396 | -87 | -218 | -511 | 141 | 589 | 320 |
| 2021 | 170 | 293 | 89 | -216 | -604 | -8 | -173 | -700 | 174 | -55 | 340 | 266 |
| 2022 | 500 | 55 | 467 | -985 | 588 | -42 | -289 | -175 | -433 | -35 | 533 | 395 |
| 2023 | 15 | 155 | -273 | 133 | -333 | -180 | -13 | 7 | -253 | -350 | 253 | 212 |
| 2024 | -84 | 559 | -98 | 4 | -991 | 614 | ||||||
| - = No Data Reported; -- = Not Applicable; NA = Not Available; W = Withheld to avoid disclosure of individual company data. |
| Release Date: 8/30/2024 |
| Next Release Date: 9/30/2024 |