|
Download Data (XLS File) |
|
||||||||
|
||||||||
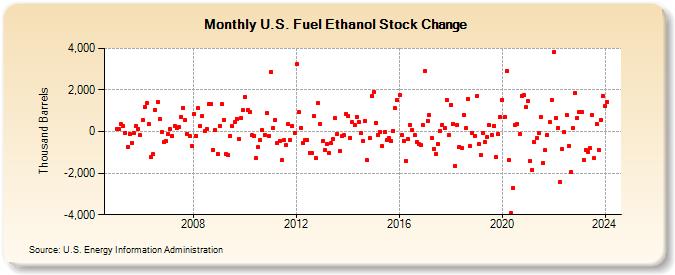
| U.S. Fuel Ethanol Stock Change (Thousand Barrels) | ||||||||
| Year | Jan | Feb | Mar | Apr | May | Jun | Jul | Aug | Sep | Oct | Nov | Dec |
|---|---|---|---|---|---|---|---|---|---|---|---|---|
| 2005 | 140 | 119 | 344 | 256 | -51 | -746 | -138 | -528 | -81 | 274 | 132 | -160 |
| 2006 | 536 | 1,169 | 1,358 | 364 | -1,223 | -1,092 | 1,031 | 1,427 | 592 | -2 | -491 | -472 |
| 2007 | -104 | 109 | -226 | 268 | 159 | 205 | 695 | 1,145 | 544 | -106 | -231 | -683 |
| 2008 | 848 | -210 | 1,115 | 284 | 725 | 26 | 125 | 1,323 | 1,339 | -896 | 72 | -1,060 |
| 2009 | 288 | 1,320 | 577 | -1,089 | -1,149 | -199 | 249 | 448 | 612 | -350 | 645 | 1,016 |
| 2010 | 1,657 | 1,046 | 925 | -180 | -191 | -1,286 | -756 | -429 | 57 | -159 | 872 | -209 |
| 2011 | 2,885 | 190 | 577 | -528 | -456 | -1,392 | -429 | -665 | 342 | -427 | 270 | -70 |
| 2012 | 3,237 | 918 | 190 | -533 | -415 | -396 | -1,015 | -1,044 | 741 | -1,295 | 1,366 | 358 |
| 2013 | -456 | -885 | -599 | -1,040 | -566 | -376 | 644 | -127 | -959 | -236 | -181 | 855 |
| 2014 | 729 | -288 | 445 | 300 | 720 | 455 | -89 | -478 | 506 | -1,383 | -306 | 1,704 |
| 2015 | 1,908 | 410 | -179 | -24 | -700 | -26 | -427 | -311 | -446 | 40 | 1,115 | 1,497 |
| 2016 | 1,751 | -176 | -441 | -1,394 | -374 | 322 | 97 | -183 | -485 | -600 | -650 | 295 |
| 2017 | 2,921 | 516 | 786 | -310 | -816 | -1,085 | -603 | 19 | 321 | 156 | 1,540 | -160 |
| 2018 | 1,299 | 380 | -1,638 | 295 | -725 | -777 | 791 | 156 | 1,588 | -714 | -80 | -200 |
| 2019 | 1,697 | -609 | -1,110 | -65 | -488 | -260 | 309 | -165 | 285 | -1,228 | -138 | 706 |
| 2020 | 1,532 | 698 | 2,923 | -1,381 | -3,934 | -2,718 | 312 | 358 | -134 | 1,730 | 1,765 | 1,161 |
| 2021 | 1,454 | -1,405 | -1,843 | -500 | -312 | -77 | 676 | -1,521 | -900 | -169 | 436 | 1,533 |
| 2022 | 3,838 | 647 | 179 | -2,416 | -858 | -41 | 813 | -688 | -1,969 | 168 | 1,867 | 670 |
| 2023 | 957 | 917 | -1,349 | -865 | -975 | -812 | 802 | -1,285 | 359 | -866 | 576 | 1,705 |
| 2024 | 1,216 | 1,428 | ||||||||||
| - = No Data Reported; -- = Not Applicable; NA = Not Available; W = Withheld to avoid disclosure of individual company data. |
| Release Date: 4/30/2024 |
| Next Release Date: 5/31/2024 |
Referring Pages: