|
Download Data (XLS File) |
|
||||||||
|
||||||||
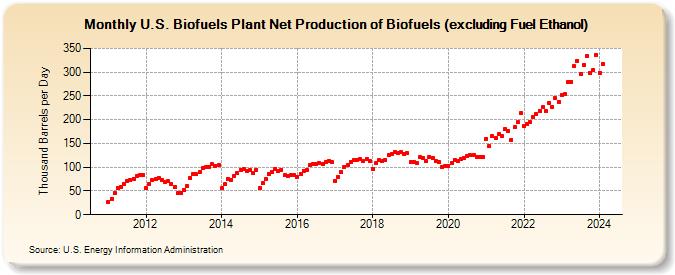
| U.S. Biofuels Plant Net Production of Biofuels (excluding Fuel Ethanol) (Thousand Barrels per Day) | ||||||||
| Year | Jan | Feb | Mar | Apr | May | Jun | Jul | Aug | Sep | Oct | Nov | Dec |
|---|---|---|---|---|---|---|---|---|---|---|---|---|
| 2011 | 27 | 34 | 46 | 56 | 59 | 65 | 70 | 73 | 76 | 81 | 83 | 84 |
| 2012 | 56 | 65 | 73 | 75 | 78 | 74 | 69 | 70 | 65 | 58 | 45 | 45 |
| 2013 | 53 | 60 | 78 | 85 | 85 | 90 | 99 | 100 | 101 | 106 | 103 | 104 |
| 2014 | 56 | 64 | 76 | 74 | 82 | 88 | 94 | 96 | 92 | 94 | 87 | 95 |
| 2015 | 56 | 66 | 75 | 86 | 90 | 97 | 93 | 95 | 83 | 82 | 84 | 83 |
| 2016 | 80 | 86 | 92 | 95 | 104 | 107 | 107 | 109 | 107 | 111 | 114 | 110 |
| 2017 | 71 | 80 | 89 | 101 | 105 | 111 | 115 | 115 | 117 | 113 | 117 | 113 |
| 2018 | 96 | 109 | 115 | 113 | 116 | 126 | 128 | 132 | 130 | 131 | 127 | 129 |
| 2019 | 111 | 111 | 108 | 121 | 119 | 112 | 122 | 120 | 113 | 111 | 101 | 102 |
| 2020 | 103 | 108 | 116 | 114 | 117 | 120 | 124 | 125 | 126 | 121 | 121 | 121 |
| 2021 | 160 | 144 | 165 | 161 | 169 | 166 | 180 | 177 | 158 | 184 | 195 | 214 |
| 2022 | 187 | 190 | 195 | 206 | 212 | 219 | 226 | 219 | 236 | 227 | 245 | 238 |
| 2023 | 252 | 253 | 279 | 280 | 312 | 324 | 296 | 315 | 334 | 298 | 305 | 336 |
| 2024 | 299 | 318 | ||||||||||
| - = No Data Reported; -- = Not Applicable; NA = Not Available; W = Withheld to avoid disclosure of individual company data. |
| Release Date: 4/30/2024 |
| Next Release Date: 5/31/2024 |