|
Download Data (XLS File) |
|
||||||||
|
||||||||
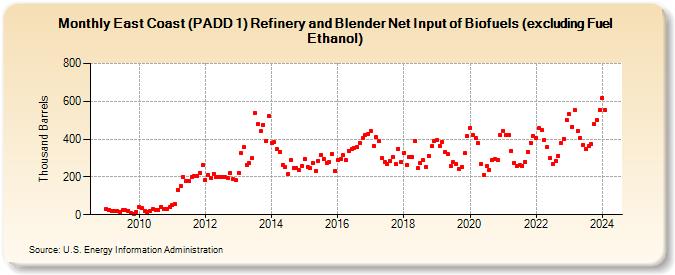
| East Coast (PADD 1) Refinery and Blender Net Input of Biofuels (excluding Fuel Ethanol) (Thousand Barrels) | ||||||||
| Year | Jan | Feb | Mar | Apr | May | Jun | Jul | Aug | Sep | Oct | Nov | Dec |
|---|---|---|---|---|---|---|---|---|---|---|---|---|
| 2009 | 29 | 26 | 22 | 21 | 20 | 16 | 24 | 23 | 21 | 11 | 6 | 16 |
| 2010 | 41 | 33 | 21 | 12 | 21 | 30 | 24 | 26 | 43 | 32 | 30 | 40 |
| 2011 | 49 | 55 | 132 | 152 | 202 | 178 | 176 | 202 | 206 | 206 | 222 | 261 |
| 2012 | 184 | 212 | 192 | 217 | 200 | 198 | 198 | 197 | 196 | 223 | 187 | 182 |
| 2013 | 220 | 325 | 357 | 264 | 272 | 298 | 540 | 479 | 442 | 475 | 391 | 522 |
| 2014 | 381 | 383 | 345 | 334 | 264 | 252 | 215 | 288 | 249 | 248 | 235 | 258 |
| 2015 | 295 | 254 | 245 | 276 | 233 | 286 | 317 | 294 | 274 | 280 | 321 | 230 |
| 2016 | 291 | 294 | 314 | 290 | 339 | 345 | 353 | 358 | 380 | 405 | 420 | 425 |
| 2017 | 443 | 366 | 410 | 389 | 300 | 279 | 268 | 285 | 305 | 268 | 348 | 279 |
| 2018 | 329 | 262 | 306 | 306 | 391 | 245 | 271 | 287 | 254 | 311 | 361 | 391 |
| 2019 | 397 | 365 | 385 | 332 | 319 | 260 | 277 | 268 | 244 | 255 | 324 | 416 |
| 2020 | 461 | 423 | 404 | 378 | 269 | 211 | 259 | 239 | 290 | 293 | 289 | 420 |
| 2021 | 445 | 422 | 421 | 339 | 275 | 257 | 261 | 259 | 281 | 334 | 381 | 417 |
| 2022 | 408 | 457 | 447 | 396 | 359 | 299 | 266 | 286 | 312 | 379 | 403 | 503 |
| 2023 | 531 | 464 | 556 | 445 | 408 | 370 | 347 | 364 | 374 | 479 | 502 | 555 |
| 2024 | 619 | |||||||||||
| - = No Data Reported; -- = Not Applicable; NA = Not Available; W = Withheld to avoid disclosure of individual company data. |
| Release Date: 3/29/2024 |
| Next Release Date: 4/30/2024 |