|
Download Data (XLS File) |
|
||||||||
|
||||||||
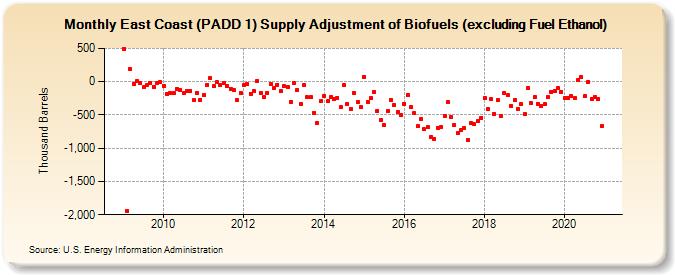
| East Coast (PADD 1) Supply Adjustment of Biofuels (excluding Fuel Ethanol) (Thousand Barrels) | ||||||||
| Year | Jan | Feb | Mar | Apr | May | Jun | Jul | Aug | Sep | Oct | Nov | Dec |
|---|---|---|---|---|---|---|---|---|---|---|---|---|
| 2009 | 497 | -1,944 | 190 | -36 | 8 | -26 | -85 | -43 | -16 | -75 | -15 | -11 |
| 2010 | -61 | -181 | -171 | -174 | -104 | -120 | -171 | -142 | -140 | -278 | -165 | -270 |
| 2011 | -201 | -44 | 50 | -70 | -10 | -49 | -20 | -67 | -105 | -124 | -280 | -170 |
| 2012 | -55 | -39 | -181 | -141 | 12 | -168 | -238 | -170 | -35 | -96 | -43 | -140 |
| 2013 | -66 | -77 | -302 | -19 | -128 | -339 | -46 | -238 | -232 | -465 | -616 | -290 |
| 2014 | -210 | -296 | -235 | -255 | -245 | -387 | -53 | -339 | -407 | -170 | -306 | -385 |
| 2015 | 75 | -299 | -253 | -152 | -436 | -570 | -651 | -441 | -273 | -348 | -453 | -502 |
| 2016 | -329 | -198 | -384 | -478 | -672 | -564 | -712 | -684 | -831 | -859 | -691 | -680 |
| 2017 | -520 | -312 | -536 | -654 | -774 | -721 | -704 | -884 | -623 | -643 | -594 | -541 |
| 2018 | -239 | -410 | -267 | -485 | -280 | -522 | -168 | -208 | -361 | -277 | -405 | -340 |
| 2019 | -489 | -100 | -320 | -232 | -330 | -368 | -342 | -230 | -151 | -142 | -101 | -151 |
| 2020 | -245 | -248 | -222 | -247 | 19 | 63 | -222 | -5 | -254 | -227 | -264 | -666 |
| - = No Data Reported; -- = Not Applicable; NA = Not Available; W = Withheld to avoid disclosure of individual company data. |
| Release Date: 3/29/2024 |
| Next Release Date: 4/30/2024 |