|
Download Data (XLS File) |
|
||||||||
|
||||||||
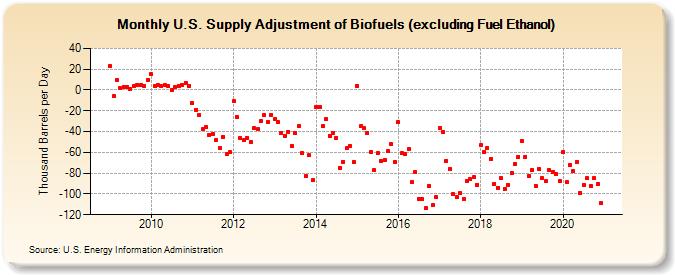
| U.S. Supply Adjustment of Biofuels (excluding Fuel Ethanol) (Thousand Barrels per Day) | ||||||||
| Year | Jan | Feb | Mar | Apr | May | Jun | Jul | Aug | Sep | Oct | Nov | Dec |
|---|---|---|---|---|---|---|---|---|---|---|---|---|
| 2009 | 23 | -6 | 10 | 2 | 3 | 3 | 1 | 4 | 5 | 5 | 4 | 10 |
| 2010 | 15 | 4 | 5 | 4 | 5 | 4 | 0 | 3 | 4 | 5 | 7 | 4 |
| 2011 | -13 | -19 | -24 | -38 | -36 | -43 | -42 | -48 | -56 | -45 | -62 | -60 |
| 2012 | -11 | -26 | -46 | -48 | -46 | -50 | -37 | -38 | -30 | -24 | -31 | -24 |
| 2013 | -28 | -31 | -41 | -44 | -40 | -54 | -41 | -35 | -61 | -83 | -63 | -87 |
| 2014 | -16 | -16 | -35 | -28 | -44 | -41 | -46 | -75 | -69 | -56 | -54 | -69 |
| 2015 | 4 | -35 | -37 | -41 | -60 | -77 | -61 | -68 | -67 | -59 | -52 | -69 |
| 2016 | -31 | -61 | -62 | -57 | -89 | -79 | -105 | -105 | -114 | -92 | -111 | -103 |
| 2017 | -37 | -40 | -68 | -76 | -100 | -103 | -99 | -105 | -88 | -86 | -84 | -91 |
| 2018 | -53 | -60 | -56 | -66 | -90 | -94 | -85 | -95 | -91 | -80 | -71 | -64 |
| 2019 | -49 | -64 | -83 | -77 | -92 | -76 | -85 | -88 | -77 | -79 | -81 | -88 |
| 2020 | -60 | -89 | -72 | -78 | -69 | -99 | -91 | -85 | -92 | -85 | -90 | -109 |
| - = No Data Reported; -- = Not Applicable; NA = Not Available; W = Withheld to avoid disclosure of individual company data. |
| Release Date: 3/29/2024 |
| Next Release Date: 4/30/2024 |