|
Download Data (XLS File) |
|
||||||||
|
||||||||
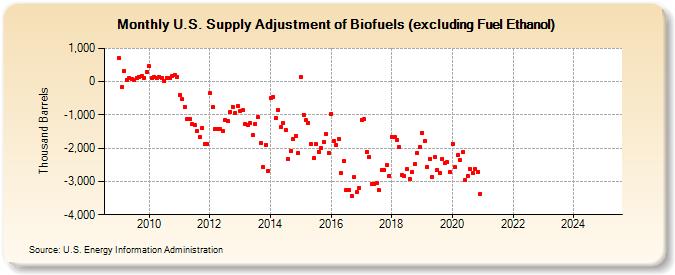
| U.S. Supply Adjustment of Biofuels (excluding Fuel Ethanol) (Thousand Barrels) | ||||||||
| Year | Jan | Feb | Mar | Apr | May | Jun | Jul | Aug | Sep | Oct | Nov | Dec |
|---|---|---|---|---|---|---|---|---|---|---|---|---|
| 2009 | 706 | -171 | 315 | 55 | 102 | 89 | 44 | 123 | 152 | 165 | 118 | 298 |
| 2010 | 457 | 105 | 153 | 109 | 153 | 121 | 5 | 106 | 111 | 157 | 202 | 133 |
| 2011 | -406 | -533 | -752 | -1,127 | -1,128 | -1,280 | -1,306 | -1,487 | -1,668 | -1,380 | -1,862 | -1,874 |
| 2012 | -354 | -768 | -1,423 | -1,436 | -1,433 | -1,492 | -1,159 | -1,180 | -904 | -748 | -933 | -735 |
| 2013 | -871 | -863 | -1,269 | -1,312 | -1,250 | -1,613 | -1,261 | -1,073 | -1,844 | -2,568 | -1,902 | -2,682 |
| 2014 | -486 | -449 | -1,094 | -850 | -1,364 | -1,241 | -1,439 | -2,332 | -2,079 | -1,722 | -1,635 | -2,143 |
| 2015 | 138 | -989 | -1,161 | -1,235 | -1,865 | -2,306 | -1,881 | -2,102 | -2,004 | -1,815 | -1,564 | -2,134 |
| 2016 | -960 | -1,770 | -1,908 | -1,720 | -2,756 | -2,372 | -3,268 | -3,250 | -3,431 | -2,860 | -3,330 | -3,192 |
| 2017 | -1,144 | -1,126 | -2,104 | -2,270 | -3,085 | -3,086 | -3,056 | -3,262 | -2,651 | -2,661 | -2,510 | -2,825 |
| 2018 | -1,652 | -1,666 | -1,749 | -1,977 | -2,796 | -2,832 | -2,629 | -2,935 | -2,730 | -2,479 | -2,140 | -1,978 |
| 2019 | -1,533 | -1,797 | -2,565 | -2,314 | -2,855 | -2,273 | -2,644 | -2,732 | -2,311 | -2,437 | -2,425 | -2,723 |
| 2020 | -1,861 | -2,573 | -2,219 | -2,341 | -2,127 | -2,966 | -2,829 | -2,630 | -2,749 | -2,633 | -2,701 | -3,370 |
| 2021 | -- | -- | -- | -- | -- | -- | -- | -- | -- | -- | -- | |
| 2022 | -- | -- | -- | -- | -- | -- | -- | -- | -- | -- | -- | -- |
| 2023 | -- | -- | -- | -- | -- | -- | -- | -- | -- | -- | -- | -- |
| 2024 | -- | |||||||||||
| - = No Data Reported; -- = Not Applicable; NA = Not Available; W = Withheld to avoid disclosure of individual company data. |
| Release Date: 3/29/2024 |
| Next Release Date: 4/30/2024 |