|
Download Data (XLS File) |
|
||||||||
|
||||||||
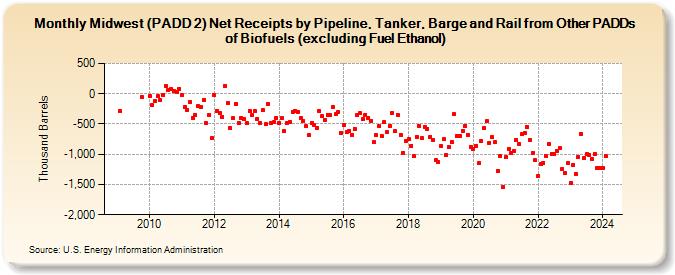
| Midwest (PADD 2) Net Receipts by Pipeline, Tanker, Barge and Rail from Other PADDs of Biofuels (excluding Fuel Ethanol) (Thousand Barrels) | ||||||||
| Year | Jan | Feb | Mar | Apr | May | Jun | Jul | Aug | Sep | Oct | Nov | Dec |
|---|---|---|---|---|---|---|---|---|---|---|---|---|
| 2009 | -287 | -54 | ||||||||||
| 2010 | -37 | -188 | -124 | -43 | -111 | -16 | 129 | 68 | 74 | 43 | 23 | 83 |
| 2011 | -20 | -223 | -264 | -140 | -398 | -351 | -203 | -218 | -106 | -490 | -349 | -734 |
| 2012 | -21 | -281 | -315 | -384 | 130 | -155 | -570 | -405 | -162 | -481 | -395 | -418 |
| 2013 | -485 | -283 | -352 | -293 | -413 | -487 | -277 | -507 | -165 | -481 | -472 | -397 |
| 2014 | -483 | -398 | -617 | -479 | -464 | -300 | -278 | -304 | -401 | -450 | -539 | -689 |
| 2015 | -488 | -516 | -562 | -289 | -374 | -434 | -348 | -356 | -212 | -340 | -305 | -643 |
| 2016 | -515 | -638 | -609 | -681 | -580 | -355 | -326 | -420 | -346 | -393 | -449 | -800 |
| 2017 | -690 | -533 | -696 | -469 | -638 | -531 | -317 | -622 | -348 | -681 | -974 | -779 |
| 2018 | -750 | -858 | -1,036 | -715 | -533 | -739 | -543 | -575 | -708 | -768 | -1,101 | -1,126 |
| 2019 | -861 | -754 | -1,012 | -883 | -798 | -343 | -691 | -694 | -612 | -529 | -674 | -880 |
| 2020 | -908 | -858 | -1,146 | -775 | -570 | -458 | -809 | -718 | -802 | -1,275 | -1,031 | -1,540 |
| 2021 | -1,052 | -906 | -973 | -940 | -766 | -827 | -670 | -646 | -542 | -758 | -973 | -1,101 |
| 2022 | -1,360 | -1,158 | -1,145 | -1,033 | -830 | -989 | -997 | -944 | -903 | -1,243 | -1,308 | -1,153 |
| 2023 | -1,468 | -1,178 | -1,322 | -1,041 | -667 | -1,061 | -1,001 | -1,007 | -1,074 | -995 | -1,220 | -1,222 |
| 2024 | -1,224 | |||||||||||
| - = No Data Reported; -- = Not Applicable; NA = Not Available; W = Withheld to avoid disclosure of individual company data. |
| Release Date: 3/29/2024 |
| Next Release Date: 4/30/2024 |