|
Download Data (XLS File) |
|
||||||||
|
||||||||
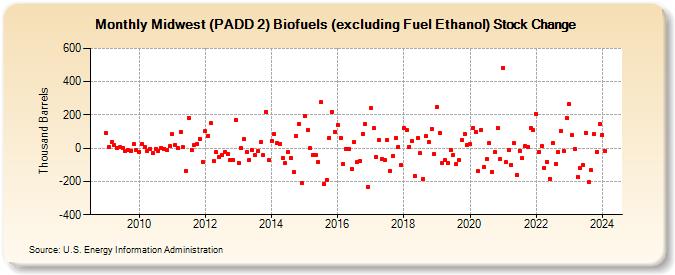
| Midwest (PADD 2) Biofuels (excluding Fuel Ethanol) Stock Change (Thousand Barrels) | ||||||||
| Year | Jan | Feb | Mar | Apr | May | Jun | Jul | Aug | Sep | Oct | Nov | Dec |
|---|---|---|---|---|---|---|---|---|---|---|---|---|
| 2009 | 90 | 7 | 36 | 18 | 1 | 5 | -1 | -17 | -13 | -15 | 24 | -11 |
| 2010 | -20 | 25 | 7 | -16 | -3 | -26 | -4 | -15 | 0 | -2 | -10 | 11 |
| 2011 | 83 | 22 | 0 | 100 | 5 | -135 | 184 | -8 | 21 | 28 | 58 | -83 |
| 2012 | 101 | 75 | 149 | -80 | -23 | -53 | -39 | -25 | -33 | -74 | -71 | 172 |
| 2013 | -89 | 1 | 54 | -22 | -71 | -11 | -43 | -19 | 35 | -43 | 220 | -72 |
| 2014 | 46 | 84 | 32 | 28 | -60 | -91 | -20 | -60 | -144 | 72 | 147 | -211 |
| 2015 | 191 | 107 | -1 | -41 | -38 | -84 | 276 | -214 | -190 | 64 | 220 | 100 |
| 2016 | 142 | 64 | -93 | -2 | -3 | -125 | 39 | -86 | -77 | 86 | 145 | -231 |
| 2017 | 240 | 119 | -51 | 48 | -63 | -69 | 51 | -136 | -46 | 63 | 9 | -99 |
| 2018 | 122 | 107 | 9 | 43 | -166 | 60 | -31 | -184 | 72 | 36 | 118 | -32 |
| 2019 | 249 | 91 | -89 | -70 | -91 | -8 | -40 | -98 | -74 | 48 | 85 | 19 |
| 2020 | 25 | 123 | 99 | -138 | 109 | -111 | -64 | 31 | -142 | -24 | 124 | -67 |
| 2021 | 484 | -86 | -8 | -101 | 31 | -162 | -15 | -60 | 12 | 7 | 119 | 107 |
| 2022 | 207 | -22 | 11 | -119 | -83 | -183 | 32 | -94 | -22 | 104 | -16 | 182 |
| 2023 | 263 | 77 | -4 | -173 | -121 | -102 | 93 | -205 | -134 | 85 | -21 | 143 |
| 2024 | 82 | |||||||||||
| - = No Data Reported; -- = Not Applicable; NA = Not Available; W = Withheld to avoid disclosure of individual company data. |
| Release Date: 3/29/2024 |
| Next Release Date: 4/30/2024 |