|
Download Data (XLS File) |
|
||||||||
|
||||||||
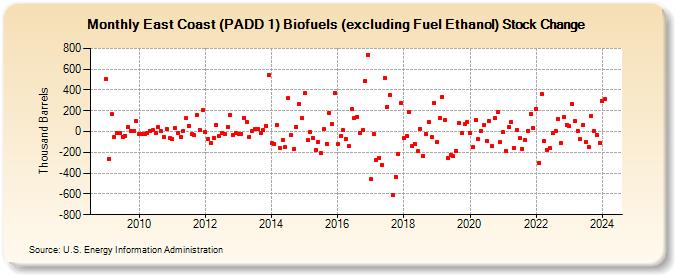
| East Coast (PADD 1) Biofuels (excluding Fuel Ethanol) Stock Change (Thousand Barrels) | ||||||||
| Year | Jan | Feb | Mar | Apr | May | Jun | Jul | Aug | Sep | Oct | Nov | Dec |
|---|---|---|---|---|---|---|---|---|---|---|---|---|
| 2009 | 504 | -263 | 168 | -57 | -12 | -15 | -49 | -39 | 40 | 8 | 8 | 100 |
| 2010 | -28 | -23 | -27 | -15 | 8 | 11 | -17 | 40 | 2 | -51 | 26 | -63 |
| 2011 | -72 | 36 | -13 | -50 | 5 | 127 | 53 | -26 | -34 | 160 | 13 | 203 |
| 2012 | -5 | -72 | -114 | -62 | 67 | -38 | -17 | -19 | 46 | 161 | -37 | -18 |
| 2013 | -19 | -21 | 134 | 94 | -49 | 4 | 22 | 21 | -12 | 13 | 51 | 548 |
| 2014 | -113 | -116 | 62 | -157 | -78 | -151 | 321 | -31 | -170 | 47 | 264 | 129 |
| 2015 | 370 | -82 | -5 | -60 | -174 | -97 | -210 | 24 | -116 | 181 | 69 | 370 |
| 2016 | -121 | -39 | 11 | -69 | -143 | 214 | 128 | 143 | -15 | 17 | 487 | 740 |
| 2017 | -457 | -24 | -270 | -251 | -317 | 518 | 240 | 353 | -614 | -433 | -216 | 273 |
| 2018 | -63 | -47 | 186 | -143 | -116 | -190 | 27 | -231 | -23 | 96 | -55 | 278 |
| 2019 | -98 | 129 | 333 | 108 | -254 | -227 | -239 | -189 | 84 | -18 | 71 | 89 |
| 2020 | -15 | -153 | 113 | -73 | 8 | 66 | -92 | 102 | -142 | 128 | 191 | -105 |
| 2021 | -7 | -183 | 40 | 91 | -154 | 19 | -64 | -164 | -79 | 7 | 172 | 36 |
| 2022 | 218 | -299 | 360 | -92 | -174 | -159 | -17 | 7 | 121 | -111 | 138 | 66 |
| 2023 | 49 | 267 | 102 | 9 | -76 | 65 | -98 | -146 | 153 | 10 | -32 | -110 |
| 2024 | 290 | |||||||||||
| - = No Data Reported; -- = Not Applicable; NA = Not Available; W = Withheld to avoid disclosure of individual company data. |
| Release Date: 3/29/2024 |
| Next Release Date: 4/30/2024 |