|
Download Data (XLS File) |
|
||||||||
|
||||||||
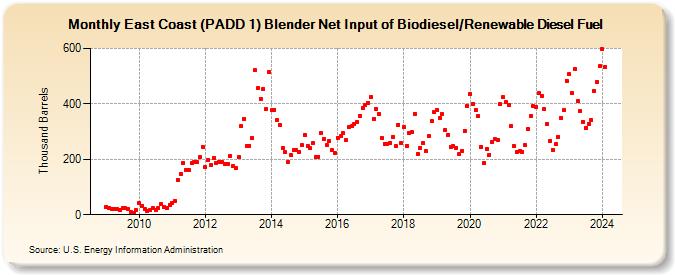
| East Coast (PADD 1) Blender Net Input of Biodiesel/Renewable Diesel Fuel (Thousand Barrels) | ||||||||
| Year | Jan | Feb | Mar | Apr | May | Jun | Jul | Aug | Sep | Oct | Nov | Dec |
|---|---|---|---|---|---|---|---|---|---|---|---|---|
| 2009 | 29 | 26 | 22 | 21 | 20 | 16 | 24 | 23 | 21 | 11 | 6 | 16 |
| 2010 | 41 | 33 | 21 | 12 | 17 | 25 | 18 | 24 | 39 | 27 | 26 | 36 |
| 2011 | 44 | 50 | 126 | 147 | 187 | 163 | 160 | 185 | 190 | 189 | 207 | 246 |
| 2012 | 171 | 199 | 179 | 204 | 187 | 189 | 189 | 184 | 184 | 213 | 175 | 170 |
| 2013 | 207 | 320 | 347 | 248 | 249 | 277 | 521 | 456 | 419 | 454 | 380 | 516 |
| 2014 | 377 | 379 | 341 | 324 | 241 | 225 | 191 | 215 | 232 | 233 | 228 | 251 |
| 2015 | 288 | 247 | 239 | 257 | 209 | 210 | 294 | 274 | 251 | 265 | 232 | 221 |
| 2016 | 277 | 283 | 294 | 268 | 315 | 320 | 329 | 335 | 357 | 385 | 397 | 403 |
| 2017 | 425 | 347 | 383 | 365 | 277 | 256 | 256 | 259 | 282 | 247 | 325 | 257 |
| 2018 | 317 | 249 | 296 | 298 | 365 | 220 | 242 | 258 | 230 | 283 | 337 | 370 |
| 2019 | 378 | 349 | 363 | 306 | 289 | 245 | 247 | 242 | 219 | 231 | 302 | 392 |
| 2020 | 436 | 401 | 378 | 356 | 245 | 187 | 237 | 217 | 263 | 272 | 271 | 398 |
| 2021 | 423 | 405 | 394 | 320 | 247 | 228 | 231 | 227 | 250 | 310 | 357 | 392 |
| 2022 | 387 | 438 | 429 | 382 | 328 | 266 | 234 | 254 | 282 | 350 | 376 | 484 |
| 2023 | 506 | 438 | 524 | 410 | 373 | 336 | 313 | 328 | 341 | 448 | 479 | 535 |
| 2024 | 597 | |||||||||||
| - = No Data Reported; -- = Not Applicable; NA = Not Available; W = Withheld to avoid disclosure of individual company data. |
| Release Date: 3/29/2024 |
| Next Release Date: 4/30/2024 |