|
Download Data (XLS File) |
|
||||||||
|
||||||||
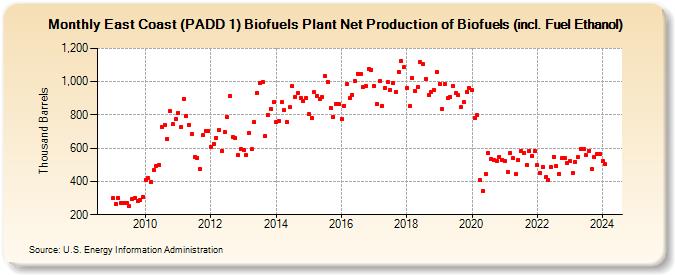
| East Coast (PADD 1) Biofuels Plant Net Production of Biofuels (incl. Fuel Ethanol) (Thousand Barrels) | ||||||||
| Year | Jan | Feb | Mar | Apr | May | Jun | Jul | Aug | Sep | Oct | Nov | Dec |
|---|---|---|---|---|---|---|---|---|---|---|---|---|
| 2009 | 298 | 267 | 299 | 270 | 271 | 272 | 250 | 292 | 303 | 282 | 288 | 306 |
| 2010 | 409 | 418 | 399 | 468 | 494 | 500 | 725 | 742 | 654 | 822 | 745 | 775 |
| 2011 | 814 | 727 | 898 | 795 | 741 | 687 | 546 | 543 | 475 | 677 | 706 | 706 |
| 2012 | 609 | 624 | 663 | 708 | 583 | 695 | 785 | 915 | 666 | 662 | 558 | 596 |
| 2013 | 588 | 559 | 689 | 593 | 756 | 932 | 994 | 998 | 673 | 801 | 835 | 875 |
| 2014 | 757 | 762 | 875 | 828 | 756 | 846 | 971 | 908 | 934 | 901 | 883 | 903 |
| 2015 | 804 | 782 | 935 | 916 | 895 | 906 | 1,031 | 998 | 842 | 788 | 864 | 867 |
| 2016 | 777 | 855 | 984 | 899 | 922 | 1,001 | 1,048 | 1,046 | 970 | 972 | 1,076 | 1,073 |
| 2017 | 974 | 866 | 1,002 | 856 | 962 | 999 | 950 | 991 | 939 | 1,061 | 1,123 | 1,086 |
| 2018 | 963 | 853 | 1,021 | 943 | 968 | 1,116 | 1,106 | 1,016 | 921 | 937 | 952 | 1,058 |
| 2019 | 987 | 837 | 987 | 901 | 909 | 972 | 932 | 918 | 846 | 877 | 938 | 962 |
| 2020 | 948 | 780 | 798 | 408 | 345 | 447 | 572 | 534 | 527 | 524 | 546 | 530 |
| 2021 | 524 | 454 | 573 | 540 | 442 | 528 | 583 | 574 | 498 | 585 | 556 | 581 |
| 2022 | 496 | 452 | 488 | 425 | 408 | 488 | 550 | 492 | 445 | 538 | 541 | 512 |
| 2023 | 523 | 455 | 518 | 544 | 598 | 595 | 557 | 586 | 474 | 547 | 567 | 565 |
| 2024 | 522 | 503 | 535 | 553 | 591 | 542 | ||||||
| - = No Data Reported; -- = Not Applicable; NA = Not Available; W = Withheld to avoid disclosure of individual company data. |
| Release Date: 8/30/2024 |
| Next Release Date: 9/30/2024 |