|
Download Data (XLS File) |
|
||||||||
|
||||||||
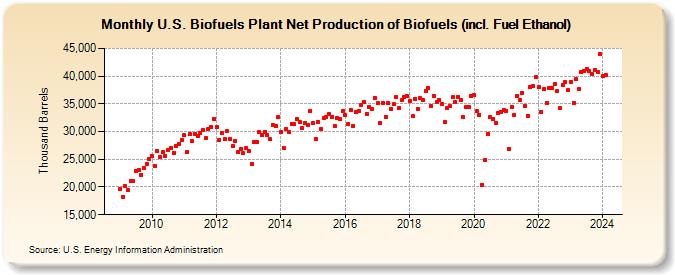
| U.S. Biofuels Plant Net Production of Biofuels (incl. Fuel Ethanol) (Thousand Barrels) | ||||||||
| Year | Jan | Feb | Mar | Apr | May | Jun | Jul | Aug | Sep | Oct | Nov | Dec |
|---|---|---|---|---|---|---|---|---|---|---|---|---|
| 2009 | 19,561 | 18,255 | 20,121 | 19,374 | 21,024 | 21,125 | 22,887 | 23,136 | 22,218 | 23,467 | 24,122 | 25,134 |
| 2010 | 25,625 | 23,802 | 26,486 | 25,384 | 26,244 | 25,632 | 26,584 | 26,964 | 26,221 | 27,471 | 27,747 | 28,457 |
| 2011 | 29,309 | 26,261 | 29,597 | 28,230 | 29,558 | 29,162 | 29,724 | 30,249 | 28,872 | 30,521 | 30,877 | 32,322 |
| 2012 | 30,789 | 28,534 | 29,799 | 28,583 | 30,044 | 28,736 | 27,363 | 28,268 | 26,325 | 26,768 | 26,107 | 26,988 |
| 2013 | 26,418 | 24,166 | 28,032 | 28,149 | 29,842 | 29,421 | 29,995 | 29,365 | 28,589 | 31,267 | 30,995 | 32,622 |
| 2014 | 29,921 | 27,070 | 30,481 | 29,956 | 31,419 | 31,274 | 32,339 | 31,652 | 30,561 | 31,572 | 31,198 | 33,789 |
| 2015 | 31,497 | 28,665 | 31,811 | 30,478 | 32,450 | 32,585 | 33,132 | 32,695 | 31,050 | 32,421 | 32,196 | 33,654 |
| 2016 | 32,942 | 31,314 | 33,818 | 31,064 | 33,568 | 33,648 | 34,800 | 35,241 | 33,254 | 34,439 | 34,114 | 36,105 |
| 2017 | 35,095 | 31,545 | 35,154 | 32,659 | 35,105 | 34,138 | 34,944 | 36,231 | 34,208 | 35,727 | 36,154 | 36,467 |
| 2018 | 35,566 | 32,720 | 35,941 | 34,073 | 35,992 | 35,707 | 37,390 | 37,875 | 34,581 | 36,428 | 35,345 | 35,731 |
| 2019 | 35,030 | 31,707 | 34,216 | 34,604 | 36,147 | 35,268 | 36,317 | 35,633 | 32,609 | 34,377 | 34,392 | 36,438 |
| 2020 | 36,542 | 33,650 | 33,003 | 20,425 | 24,787 | 29,549 | 32,557 | 32,292 | 31,569 | 33,357 | 33,535 | 33,869 |
| 2021 | 33,756 | 26,913 | 34,433 | 33,047 | 36,461 | 35,617 | 37,015 | 34,585 | 32,827 | 37,967 | 38,225 | 39,774 |
| 2022 | 37,988 | 33,616 | 37,616 | 35,137 | 37,841 | 37,866 | 38,512 | 37,318 | 34,159 | 38,462 | 38,932 | 37,436 |
| 2023 | 38,988 | 35,186 | 39,389 | 37,632 | 40,680 | 40,880 | 41,200 | 40,913 | 40,297 | 41,097 | 40,753 | 43,961 |
| 2024 | 39,946 | |||||||||||
| - = No Data Reported; -- = Not Applicable; NA = Not Available; W = Withheld to avoid disclosure of individual company data. |
| Release Date: 3/29/2024 |
| Next Release Date: 4/30/2024 |