|
Download Data (XLS File) |
|
||||||||
|
||||||||
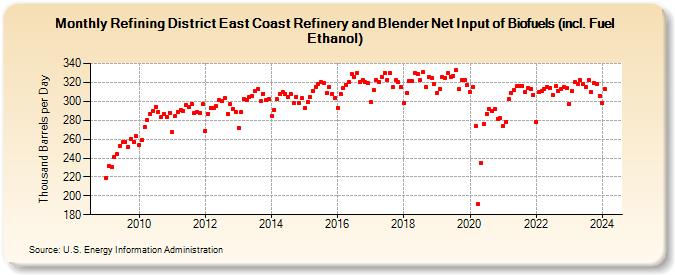
| Refining District East Coast Refinery and Blender Net Input of Biofuels (incl. Fuel Ethanol) (Thousand Barrels per Day) | ||||||||
| Year | Jan | Feb | Mar | Apr | May | Jun | Jul | Aug | Sep | Oct | Nov | Dec |
|---|---|---|---|---|---|---|---|---|---|---|---|---|
| 2009 | 219 | 232 | 231 | 241 | 244 | 253 | 257 | 257 | 252 | 260 | 257 | 263 |
| 2010 | 254 | 259 | 273 | 280 | 287 | 290 | 294 | 289 | 283 | 287 | 283 | 288 |
| 2011 | 267 | 284 | 289 | 291 | 290 | 296 | 294 | 297 | 288 | 289 | 288 | 297 |
| 2012 | 269 | 287 | 293 | 293 | 295 | 301 | 300 | 303 | 287 | 297 | 292 | 289 |
| 2013 | 272 | 289 | 302 | 301 | 305 | 306 | 311 | 313 | 300 | 308 | 301 | 302 |
| 2014 | 284 | 291 | 302 | 308 | 310 | 308 | 305 | 308 | 298 | 305 | 298 | 303 |
| 2015 | 293 | 299 | 305 | 311 | 315 | 318 | 320 | 319 | 309 | 315 | 308 | 304 |
| 2016 | 293 | 308 | 314 | 317 | 320 | 329 | 326 | 330 | 320 | 323 | 320 | 319 |
| 2017 | 299 | 312 | 323 | 320 | 326 | 330 | 323 | 330 | 315 | 322 | 320 | 315 |
| 2018 | 298 | 309 | 321 | 321 | 330 | 329 | 322 | 331 | 315 | 326 | 325 | 318 |
| 2019 | 309 | 313 | 326 | 325 | 330 | 326 | 327 | 333 | 313 | 322 | 323 | 317 |
| 2020 | 310 | 315 | 274 | 191 | 235 | 276 | 287 | 292 | 290 | 292 | 281 | 282 |
| 2021 | 274 | 278 | 302 | 309 | 312 | 316 | 316 | 316 | 310 | 314 | 313 | 307 |
| 2022 | 278 | 310 | 311 | 313 | 315 | 314 | 307 | 316 | 311 | 313 | 315 | 314 |
| 2023 | 297 | 311 | 320 | 318 | 322 | 318 | 315 | 322 | 310 | 319 | 318 | 306 |
| 2024 | 298 | |||||||||||
| - = No Data Reported; -- = Not Applicable; NA = Not Available; W = Withheld to avoid disclosure of individual company data. |
| Release Date: 3/29/2024 |
| Next Release Date: 4/30/2024 |