|
Download Data (XLS File) |
|
||||||||
|
||||||||
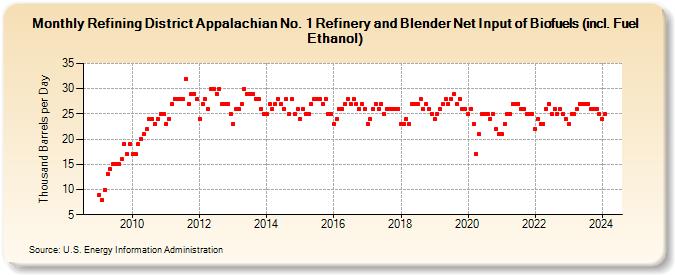
| Refining District Appalachian No. 1 Refinery and Blender Net Input of Biofuels (incl. Fuel Ethanol) (Thousand Barrels per Day) | ||||||||
| Year | Jan | Feb | Mar | Apr | May | Jun | Jul | Aug | Sep | Oct | Nov | Dec |
|---|---|---|---|---|---|---|---|---|---|---|---|---|
| 2009 | 9 | 8 | 10 | 13 | 14 | 15 | 15 | 15 | 16 | 19 | 17 | 19 |
| 2010 | 17 | 17 | 19 | 20 | 21 | 22 | 24 | 24 | 23 | 24 | 25 | 25 |
| 2011 | 23 | 24 | 27 | 28 | 28 | 28 | 28 | 32 | 27 | 29 | 29 | 28 |
| 2012 | 24 | 27 | 28 | 26 | 30 | 30 | 29 | 30 | 27 | 27 | 27 | 25 |
| 2013 | 23 | 26 | 26 | 27 | 30 | 29 | 29 | 29 | 28 | 28 | 26 | 25 |
| 2014 | 25 | 27 | 26 | 27 | 28 | 27 | 26 | 28 | 25 | 28 | 25 | 26 |
| 2015 | 24 | 26 | 25 | 25 | 27 | 28 | 28 | 28 | 27 | 28 | 25 | 25 |
| 2016 | 23 | 24 | 26 | 26 | 27 | 28 | 27 | 28 | 27 | 26 | 27 | 26 |
| 2017 | 23 | 24 | 26 | 27 | 26 | 27 | 25 | 26 | 26 | 26 | 26 | 26 |
| 2018 | 23 | 23 | 24 | 23 | 27 | 27 | 27 | 28 | 26 | 27 | 26 | 25 |
| 2019 | 24 | 25 | 26 | 27 | 28 | 27 | 28 | 29 | 27 | 28 | 26 | 26 |
| 2020 | 25 | 26 | 23 | 17 | 21 | 25 | 25 | 25 | 24 | 25 | 22 | 21 |
| 2021 | 21 | 23 | 25 | 25 | 27 | 27 | 27 | 26 | 26 | 25 | 25 | 25 |
| 2022 | 22 | 24 | 23 | 23 | 26 | 27 | 25 | 26 | 25 | 26 | 25 | 24 |
| 2023 | 23 | 25 | 25 | 26 | 27 | 27 | 27 | 27 | 26 | 26 | 26 | 25 |
| 2024 | 24 | |||||||||||
| - = No Data Reported; -- = Not Applicable; NA = Not Available; W = Withheld to avoid disclosure of individual company data. |
| Release Date: 3/29/2024 |
| Next Release Date: 4/30/2024 |