|
Download Data (XLS File) |
|
||||||||
|
||||||||
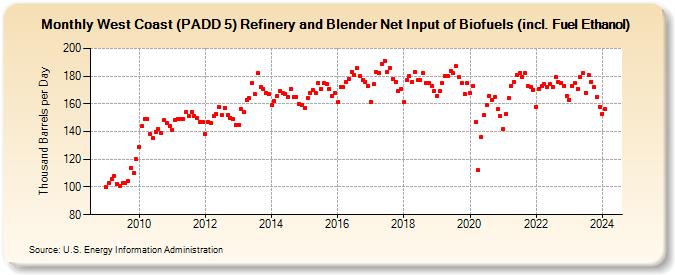
| West Coast (PADD 5) Refinery and Blender Net Input of Biofuels (incl. Fuel Ethanol) (Thousand Barrels per Day) | ||||||||
| Year | Jan | Feb | Mar | Apr | May | Jun | Jul | Aug | Sep | Oct | Nov | Dec |
|---|---|---|---|---|---|---|---|---|---|---|---|---|
| 2009 | 100 | 103 | 106 | 108 | 102 | 101 | 103 | 103 | 104 | 114 | 110 | 120 |
| 2010 | 129 | 144 | 149 | 149 | 138 | 135 | 140 | 142 | 139 | 148 | 146 | 144 |
| 2011 | 141 | 148 | 149 | 149 | 149 | 154 | 151 | 154 | 151 | 150 | 147 | 147 |
| 2012 | 138 | 147 | 146 | 151 | 153 | 158 | 152 | 157 | 152 | 150 | 149 | 145 |
| 2013 | 145 | 156 | 154 | 163 | 164 | 175 | 167 | 182 | 172 | 171 | 168 | 167 |
| 2014 | 159 | 162 | 166 | 169 | 168 | 167 | 165 | 171 | 165 | 165 | 160 | 159 |
| 2015 | 157 | 164 | 168 | 170 | 168 | 175 | 171 | 175 | 174 | 171 | 166 | 168 |
| 2016 | 161 | 172 | 172 | 176 | 178 | 183 | 181 | 186 | 180 | 177 | 176 | 173 |
| 2017 | 161 | 174 | 183 | 182 | 189 | 191 | 183 | 186 | 178 | 176 | 169 | 171 |
| 2018 | 161 | 177 | 180 | 176 | 183 | 177 | 177 | 182 | 175 | 175 | 173 | 169 |
| 2019 | 166 | 169 | 175 | 180 | 180 | 184 | 182 | 187 | 179 | 175 | 167 | 175 |
| 2020 | 168 | 173 | 147 | 112 | 136 | 152 | 159 | 166 | 163 | 165 | 156 | 151 |
| 2021 | 142 | 153 | 164 | 173 | 176 | 181 | 182 | 179 | 182 | 173 | 172 | 170 |
| 2022 | 158 | 171 | 173 | 174 | 172 | 174 | 172 | 179 | 176 | 175 | 173 | 166 |
| 2023 | 163 | 173 | 175 | 171 | 179 | 182 | 168 | 181 | 176 | 172 | 165 | 158 |
| 2024 | 153 | |||||||||||
| - = No Data Reported; -- = Not Applicable; NA = Not Available; W = Withheld to avoid disclosure of individual company data. |
| Release Date: 3/29/2024 |
| Next Release Date: 4/30/2024 |