|
Download Data (XLS File) |
|
||||||||
|
||||||||
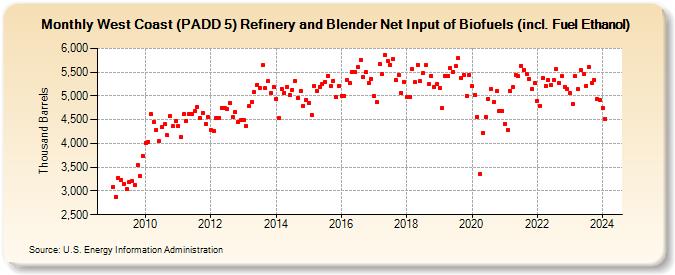
| West Coast (PADD 5) Refinery and Blender Net Input of Biofuels (incl. Fuel Ethanol) (Thousand Barrels) | ||||||||
| Year | Jan | Feb | Mar | Apr | May | Jun | Jul | Aug | Sep | Oct | Nov | Dec |
|---|---|---|---|---|---|---|---|---|---|---|---|---|
| 2009 | 3,087 | 2,882 | 3,278 | 3,237 | 3,152 | 3,033 | 3,178 | 3,199 | 3,121 | 3,546 | 3,311 | 3,730 |
| 2010 | 4,011 | 4,038 | 4,612 | 4,455 | 4,289 | 4,049 | 4,336 | 4,400 | 4,167 | 4,577 | 4,365 | 4,469 |
| 2011 | 4,366 | 4,130 | 4,619 | 4,479 | 4,628 | 4,611 | 4,676 | 4,772 | 4,535 | 4,649 | 4,418 | 4,564 |
| 2012 | 4,286 | 4,269 | 4,541 | 4,539 | 4,756 | 4,741 | 4,715 | 4,858 | 4,550 | 4,663 | 4,455 | 4,494 |
| 2013 | 4,487 | 4,365 | 4,778 | 4,882 | 5,086 | 5,238 | 5,174 | 5,643 | 5,165 | 5,313 | 5,054 | 5,183 |
| 2014 | 4,936 | 4,537 | 5,155 | 5,067 | 5,198 | 5,009 | 5,127 | 5,315 | 4,962 | 5,101 | 4,795 | 4,920 |
| 2015 | 4,855 | 4,605 | 5,210 | 5,102 | 5,196 | 5,241 | 5,298 | 5,429 | 5,216 | 5,315 | 4,970 | 5,206 |
| 2016 | 5,001 | 4,993 | 5,340 | 5,265 | 5,513 | 5,503 | 5,599 | 5,766 | 5,388 | 5,497 | 5,267 | 5,365 |
| 2017 | 5,001 | 4,864 | 5,674 | 5,451 | 5,862 | 5,732 | 5,660 | 5,774 | 5,334 | 5,448 | 5,064 | 5,303 |
| 2018 | 4,977 | 4,967 | 5,570 | 5,284 | 5,660 | 5,312 | 5,473 | 5,654 | 5,241 | 5,428 | 5,193 | 5,243 |
| 2019 | 5,161 | 4,741 | 5,429 | 5,413 | 5,583 | 5,511 | 5,633 | 5,788 | 5,370 | 5,437 | 5,003 | 5,438 |
| 2020 | 5,201 | 5,027 | 4,551 | 3,360 | 4,227 | 4,559 | 4,930 | 5,150 | 4,879 | 5,100 | 4,685 | 4,691 |
| 2021 | 4,412 | 4,286 | 5,093 | 5,182 | 5,446 | 5,418 | 5,635 | 5,549 | 5,468 | 5,359 | 5,150 | 5,278 |
| 2022 | 4,899 | 4,792 | 5,377 | 5,205 | 5,326 | 5,223 | 5,328 | 5,561 | 5,274 | 5,418 | 5,196 | 5,135 |
| 2023 | 5,054 | 4,833 | 5,414 | 5,136 | 5,536 | 5,465 | 5,211 | 5,618 | 5,275 | 5,344 | 4,939 | 4,913 |
| 2024 | 4,751 | |||||||||||
| - = No Data Reported; -- = Not Applicable; NA = Not Available; W = Withheld to avoid disclosure of individual company data. |
| Release Date: 3/29/2024 |
| Next Release Date: 4/30/2024 |