|
Download Data (XLS File) |
|
||||||||
|
||||||||
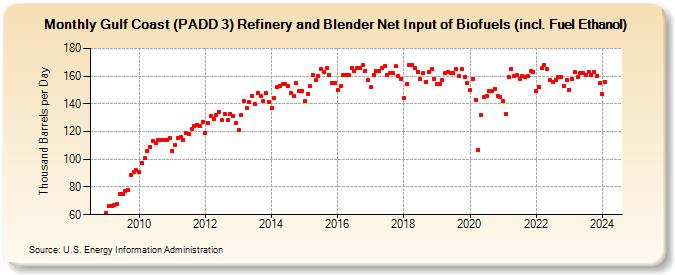
| Gulf Coast (PADD 3) Refinery and Blender Net Input of Biofuels (incl. Fuel Ethanol) (Thousand Barrels per Day) | ||||||||
| Year | Jan | Feb | Mar | Apr | May | Jun | Jul | Aug | Sep | Oct | Nov | Dec |
|---|---|---|---|---|---|---|---|---|---|---|---|---|
| 2009 | 61 | 66 | 66 | 67 | 68 | 75 | 75 | 77 | 78 | 89 | 91 | 92 |
| 2010 | 91 | 97 | 101 | 106 | 109 | 113 | 112 | 114 | 114 | 114 | 114 | 115 |
| 2011 | 106 | 110 | 115 | 116 | 114 | 119 | 118 | 122 | 124 | 125 | 124 | 127 |
| 2012 | 119 | 126 | 131 | 129 | 132 | 134 | 128 | 133 | 128 | 133 | 131 | 126 |
| 2013 | 121 | 132 | 142 | 137 | 141 | 146 | 140 | 148 | 146 | 142 | 148 | 141 |
| 2014 | 137 | 144 | 152 | 153 | 154 | 154 | 153 | 148 | 146 | 155 | 149 | 149 |
| 2015 | 142 | 147 | 153 | 161 | 157 | 160 | 165 | 163 | 166 | 161 | 155 | 155 |
| 2016 | 150 | 153 | 161 | 161 | 161 | 166 | 164 | 166 | 166 | 168 | 164 | 157 |
| 2017 | 152 | 161 | 164 | 164 | 166 | 167 | 161 | 162 | 162 | 167 | 160 | 158 |
| 2018 | 144 | 154 | 168 | 168 | 166 | 163 | 158 | 162 | 156 | 163 | 165 | 158 |
| 2019 | 154 | 154 | 157 | 162 | 163 | 162 | 162 | 165 | 160 | 165 | 159 | 155 |
| 2020 | 150 | 158 | 143 | 107 | 132 | 145 | 146 | 149 | 149 | 151 | 146 | 145 |
| 2021 | 142 | 133 | 159 | 165 | 160 | 161 | 158 | 160 | 159 | 160 | 164 | 163 |
| 2022 | 149 | 152 | 166 | 168 | 165 | 157 | 156 | 157 | 159 | 159 | 153 | 157 |
| 2023 | 150 | 158 | 163 | 159 | 162 | 162 | 161 | 163 | 161 | 163 | 160 | 155 |
| 2024 | 147 | |||||||||||
| - = No Data Reported; -- = Not Applicable; NA = Not Available; W = Withheld to avoid disclosure of individual company data. |
| Release Date: 3/29/2024 |
| Next Release Date: 4/30/2024 |