|
Download Data (XLS File) |
|
||||||||
|
||||||||
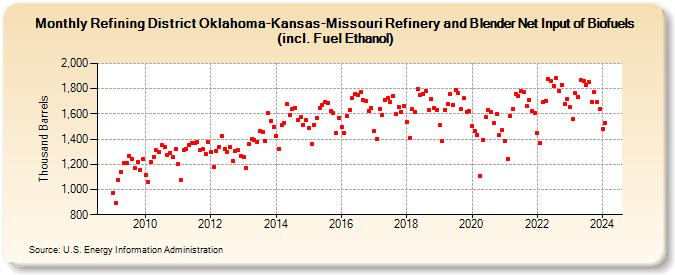
| Refining District Oklahoma-Kansas-Missouri Refinery and Blender Net Input of Biofuels (incl. Fuel Ethanol) (Thousand Barrels) | ||||||||
| Year | Jan | Feb | Mar | Apr | May | Jun | Jul | Aug | Sep | Oct | Nov | Dec |
|---|---|---|---|---|---|---|---|---|---|---|---|---|
| 2009 | 975 | 895 | 1,076 | 1,140 | 1,209 | 1,213 | 1,268 | 1,242 | 1,168 | 1,219 | 1,151 | 1,242 |
| 2010 | 1,117 | 1,061 | 1,218 | 1,257 | 1,311 | 1,294 | 1,350 | 1,335 | 1,271 | 1,290 | 1,255 | 1,318 |
| 2011 | 1,205 | 1,072 | 1,310 | 1,323 | 1,354 | 1,367 | 1,368 | 1,376 | 1,317 | 1,319 | 1,278 | 1,374 |
| 2012 | 1,296 | 1,180 | 1,308 | 1,335 | 1,424 | 1,323 | 1,298 | 1,336 | 1,230 | 1,305 | 1,312 | 1,268 |
| 2013 | 1,260 | 1,169 | 1,359 | 1,399 | 1,395 | 1,379 | 1,466 | 1,456 | 1,385 | 1,607 | 1,544 | 1,497 |
| 2014 | 1,425 | 1,322 | 1,508 | 1,528 | 1,676 | 1,591 | 1,639 | 1,647 | 1,549 | 1,574 | 1,514 | 1,549 |
| 2015 | 1,489 | 1,365 | 1,515 | 1,570 | 1,647 | 1,671 | 1,694 | 1,686 | 1,621 | 1,607 | 1,451 | 1,567 |
| 2016 | 1,493 | 1,451 | 1,580 | 1,631 | 1,728 | 1,759 | 1,747 | 1,773 | 1,709 | 1,706 | 1,625 | 1,648 |
| 2017 | 1,461 | 1,402 | 1,639 | 1,592 | 1,714 | 1,725 | 1,697 | 1,743 | 1,598 | 1,656 | 1,617 | 1,664 |
| 2018 | 1,534 | 1,405 | 1,640 | 1,615 | 1,798 | 1,750 | 1,755 | 1,779 | 1,628 | 1,716 | 1,650 | 1,632 |
| 2019 | 1,508 | 1,381 | 1,631 | 1,681 | 1,761 | 1,671 | 1,788 | 1,764 | 1,640 | 1,723 | 1,618 | 1,621 |
| 2020 | 1,502 | 1,461 | 1,432 | 1,111 | 1,395 | 1,577 | 1,632 | 1,618 | 1,528 | 1,599 | 1,435 | 1,470 |
| 2021 | 1,386 | 1,243 | 1,586 | 1,641 | 1,758 | 1,741 | 1,779 | 1,777 | 1,664 | 1,713 | 1,626 | 1,605 |
| 2022 | 1,446 | 1,367 | 1,691 | 1,706 | 1,875 | 1,858 | 1,825 | 1,884 | 1,785 | 1,833 | 1,679 | 1,722 |
| 2023 | 1,651 | 1,560 | 1,765 | 1,738 | 1,866 | 1,858 | 1,827 | 1,850 | 1,697 | 1,772 | 1,693 | 1,635 |
| 2024 | 1,479 | |||||||||||
| - = No Data Reported; -- = Not Applicable; NA = Not Available; W = Withheld to avoid disclosure of individual company data. |
| Release Date: 3/29/2024 |
| Next Release Date: 4/30/2024 |