|
Download Data (XLS File) |
|
||||||||
|
||||||||
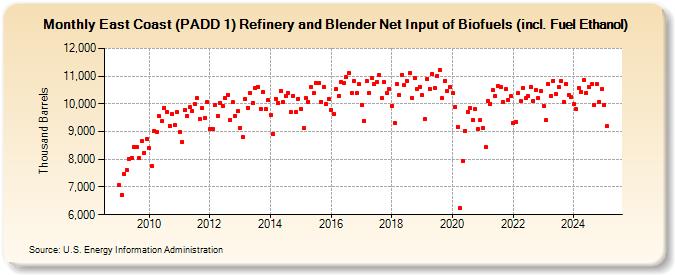
| East Coast (PADD 1) Refinery and Blender Net Input of Biofuels (incl. Fuel Ethanol) (Thousand Barrels) | ||||||||
| Year | Jan | Feb | Mar | Apr | May | Jun | Jul | Aug | Sep | Oct | Nov | Dec |
|---|---|---|---|---|---|---|---|---|---|---|---|---|
| 2009 | 7,067 | 6,719 | 7,471 | 7,604 | 8,020 | 8,056 | 8,429 | 8,432 | 8,042 | 8,649 | 8,238 | 8,737 |
| 2010 | 8,391 | 7,740 | 9,035 | 8,995 | 9,544 | 9,375 | 9,858 | 9,714 | 9,202 | 9,635 | 9,230 | 9,700 |
| 2011 | 8,981 | 8,626 | 9,782 | 9,559 | 9,870 | 9,732 | 9,985 | 10,193 | 9,452 | 9,838 | 9,504 | 10,055 |
| 2012 | 9,088 | 9,103 | 9,948 | 9,573 | 10,045 | 9,922 | 10,204 | 10,333 | 9,433 | 10,054 | 9,570 | 9,741 |
| 2013 | 9,143 | 8,810 | 10,171 | 9,861 | 10,382 | 10,045 | 10,560 | 10,621 | 9,815 | 10,427 | 9,801 | 10,146 |
| 2014 | 9,584 | 8,905 | 10,186 | 10,038 | 10,467 | 10,055 | 10,270 | 10,392 | 9,696 | 10,300 | 9,699 | 10,190 |
| 2015 | 9,825 | 9,125 | 10,203 | 10,079 | 10,609 | 10,376 | 10,764 | 10,747 | 10,083 | 10,617 | 9,987 | 10,192 |
| 2016 | 9,788 | 9,648 | 10,525 | 10,296 | 10,781 | 10,735 | 10,958 | 11,100 | 10,400 | 10,823 | 10,385 | 10,701 |
| 2017 | 9,975 | 9,395 | 10,824 | 10,408 | 10,923 | 10,700 | 10,788 | 11,055 | 10,203 | 10,778 | 10,384 | 10,546 |
| 2018 | 9,939 | 9,310 | 10,701 | 10,321 | 11,057 | 10,670 | 10,841 | 11,118 | 10,203 | 10,933 | 10,550 | 10,622 |
| 2019 | 10,312 | 9,447 | 10,895 | 10,542 | 11,083 | 10,588 | 11,005 | 11,222 | 10,198 | 10,826 | 10,461 | 10,614 |
| 2020 | 10,379 | 9,884 | 9,179 | 6,225 | 7,944 | 9,036 | 9,698 | 9,834 | 9,428 | 9,808 | 9,091 | 9,400 |
| 2021 | 9,138 | 8,429 | 10,112 | 10,009 | 10,497 | 10,288 | 10,635 | 10,612 | 10,069 | 10,519 | 10,140 | 10,272 |
| 2022 | 9,299 | 9,361 | 10,378 | 10,086 | 10,577 | 10,202 | 10,288 | 10,615 | 10,095 | 10,497 | 10,214 | 10,480 |
| 2023 | 9,907 | 9,401 | 10,710 | 10,294 | 10,825 | 10,356 | 10,595 | 10,829 | 10,089 | 10,717 | 10,315 | 10,247 |
| 2024 | 9,989 | 9,804 | ||||||||||
| - = No Data Reported; -- = Not Applicable; NA = Not Available; W = Withheld to avoid disclosure of individual company data. |
| Release Date: 4/30/2024 |
| Next Release Date: 5/31/2024 |