|
Download Data (XLS File) |
|
||||||||
|
||||||||
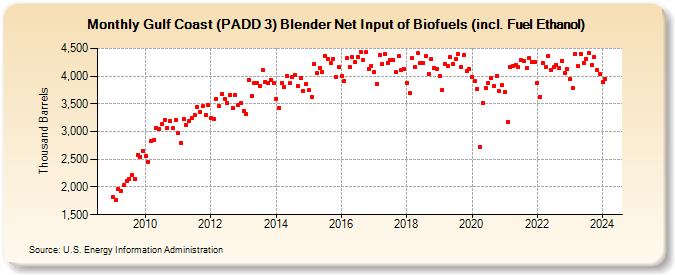
| Gulf Coast (PADD 3) Blender Net Input of Biofuels (incl. Fuel Ethanol) (Thousand Barrels) | ||||||||
| Year | Jan | Feb | Mar | Apr | May | Jun | Jul | Aug | Sep | Oct | Nov | Dec |
|---|---|---|---|---|---|---|---|---|---|---|---|---|
| 2009 | 1,814 | 1,768 | 1,971 | 1,932 | 2,029 | 2,110 | 2,151 | 2,215 | 2,150 | 2,580 | 2,550 | 2,654 |
| 2010 | 2,554 | 2,457 | 2,827 | 2,856 | 3,067 | 3,049 | 3,131 | 3,216 | 3,067 | 3,194 | 3,060 | 3,207 |
| 2011 | 2,968 | 2,795 | 3,221 | 3,121 | 3,190 | 3,236 | 3,301 | 3,438 | 3,359 | 3,453 | 3,302 | 3,480 |
| 2012 | 3,253 | 3,233 | 3,596 | 3,454 | 3,677 | 3,585 | 3,519 | 3,665 | 3,427 | 3,665 | 3,473 | 3,508 |
| 2013 | 3,367 | 3,314 | 3,933 | 3,647 | 3,871 | 3,877 | 3,814 | 4,106 | 3,894 | 3,869 | 3,936 | 3,879 |
| 2014 | 3,595 | 3,427 | 3,873 | 3,808 | 4,004 | 3,867 | 3,986 | 4,018 | 3,826 | 3,961 | 3,733 | 3,859 |
| 2015 | 3,743 | 3,630 | 4,225 | 4,050 | 4,148 | 4,077 | 4,363 | 4,308 | 4,237 | 4,302 | 3,991 | 4,156 |
| 2016 | 4,004 | 3,915 | 4,331 | 4,161 | 4,337 | 4,257 | 4,349 | 4,435 | 4,286 | 4,428 | 4,136 | 4,191 |
| 2017 | 4,073 | 3,865 | 4,379 | 4,225 | 4,407 | 4,236 | 4,299 | 4,294 | 4,074 | 4,362 | 4,106 | 4,133 |
| 2018 | 3,867 | 3,689 | 4,330 | 4,161 | 4,411 | 4,232 | 4,232 | 4,355 | 4,046 | 4,302 | 4,154 | 4,134 |
| 2019 | 4,004 | 3,753 | 4,222 | 4,184 | 4,346 | 4,214 | 4,303 | 4,405 | 4,164 | 4,383 | 4,092 | 4,135 |
| 2020 | 3,978 | 3,911 | 3,768 | 2,718 | 3,524 | 3,787 | 3,874 | 3,970 | 3,818 | 3,999 | 3,723 | 3,833 |
| 2021 | 3,709 | 3,179 | 4,167 | 4,191 | 4,202 | 4,164 | 4,287 | 4,280 | 4,139 | 4,322 | 4,252 | 4,254 |
| 2022 | 3,873 | 3,628 | 4,244 | 4,161 | 4,359 | 4,119 | 4,160 | 4,208 | 4,142 | 4,280 | 4,059 | 4,128 |
| 2023 | 3,945 | 3,777 | 4,405 | 4,180 | 4,405 | 4,244 | 4,309 | 4,422 | 4,197 | 4,342 | 4,107 | 4,047 |
| 2024 | 3,888 | |||||||||||
| - = No Data Reported; -- = Not Applicable; NA = Not Available; W = Withheld to avoid disclosure of individual company data. |
| Release Date: 3/29/2024 |
| Next Release Date: 4/30/2024 |