|
Download Data (XLS File) |
|
||||||||
|
||||||||
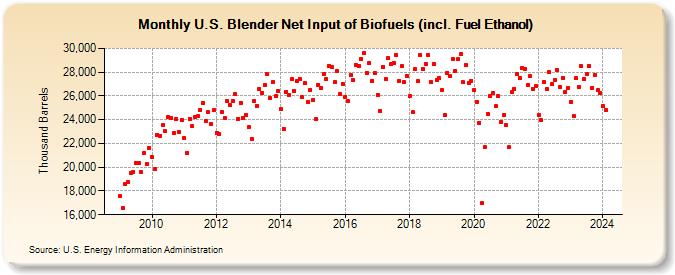
| U.S. Blender Net Input of Biofuels (incl. Fuel Ethanol) (Thousand Barrels) | ||||||||
| Year | Jan | Feb | Mar | Apr | May | Jun | Jul | Aug | Sep | Oct | Nov | Dec |
|---|---|---|---|---|---|---|---|---|---|---|---|---|
| 2009 | 17,544 | 16,606 | 18,602 | 18,720 | 19,532 | 19,574 | 20,339 | 20,376 | 19,570 | 21,234 | 20,302 | 21,648 |
| 2010 | 20,858 | 19,828 | 22,739 | 22,650 | 23,535 | 23,022 | 24,247 | 24,176 | 22,882 | 24,043 | 22,999 | 23,995 |
| 2011 | 22,447 | 21,209 | 24,061 | 23,439 | 24,230 | 24,273 | 24,849 | 25,391 | 23,896 | 24,608 | 23,633 | 24,801 |
| 2012 | 22,901 | 22,755 | 24,641 | 24,148 | 25,568 | 25,242 | 25,588 | 26,148 | 24,069 | 25,430 | 24,116 | 24,398 |
| 2013 | 23,360 | 22,410 | 25,542 | 25,152 | 26,577 | 26,285 | 26,931 | 27,821 | 25,819 | 27,158 | 25,988 | 26,428 |
| 2014 | 24,896 | 23,256 | 26,368 | 26,117 | 27,388 | 26,432 | 27,294 | 27,465 | 25,884 | 27,047 | 25,488 | 26,526 |
| 2015 | 25,637 | 24,029 | 26,957 | 26,688 | 27,825 | 27,424 | 28,544 | 28,475 | 27,133 | 28,056 | 26,123 | 27,024 |
| 2016 | 25,939 | 25,540 | 27,726 | 27,340 | 28,614 | 28,523 | 29,102 | 29,629 | 27,964 | 28,746 | 27,280 | 27,910 |
| 2017 | 26,090 | 24,706 | 28,462 | 27,460 | 29,182 | 28,657 | 28,779 | 29,426 | 27,249 | 28,523 | 27,147 | 27,635 |
| 2018 | 25,952 | 24,608 | 28,240 | 27,245 | 29,431 | 28,254 | 28,689 | 29,423 | 27,162 | 28,691 | 27,371 | 27,493 |
| 2019 | 26,461 | 24,389 | 27,951 | 27,655 | 29,107 | 28,123 | 29,073 | 29,488 | 27,136 | 28,594 | 27,066 | 27,290 |
| 2020 | 26,475 | 25,526 | 23,755 | 16,948 | 21,666 | 24,462 | 25,976 | 26,217 | 25,109 | 25,990 | 23,808 | 24,383 |
| 2021 | 23,549 | 21,673 | 26,295 | 26,610 | 27,829 | 27,497 | 28,355 | 28,277 | 26,945 | 27,635 | 26,603 | 26,802 |
| 2022 | 24,419 | 23,943 | 27,166 | 26,582 | 28,007 | 26,997 | 27,313 | 28,153 | 26,757 | 27,518 | 26,352 | 26,652 |
| 2023 | 25,467 | 24,271 | 27,480 | 26,760 | 28,479 | 27,425 | 27,823 | 28,551 | 26,691 | 27,782 | 26,475 | 26,274 |
| 2024 | 25,132 | |||||||||||
| - = No Data Reported; -- = Not Applicable; NA = Not Available; W = Withheld to avoid disclosure of individual company data. |
| Release Date: 3/29/2024 |
| Next Release Date: 4/30/2024 |
Referring Pages: