|
Download Data (XLS File) |
|
||||||||
|
||||||||
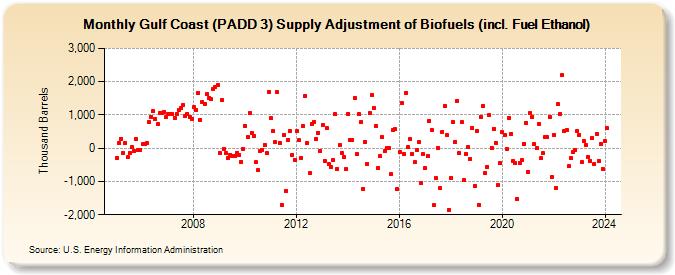
| Gulf Coast (PADD 3) Supply Adjustment of Biofuels (incl. Fuel Ethanol) (Thousand Barrels) | ||||||||
| Year | Jan | Feb | Mar | Apr | May | Jun | Jul | Aug | Sep | Oct | Nov | Dec |
|---|---|---|---|---|---|---|---|---|---|---|---|---|
| 2005 | -292 | 159 | 291 | -148 | 157 | -275 | -133 | 22 | -72 | 272 | -59 | -51 |
| 2006 | 115 | 121 | 151 | 778 | 952 | 1,112 | 873 | 713 | 1,070 | 1,055 | 1,096 | 924 |
| 2007 | 1,026 | 1,038 | 1,029 | 918 | 1,036 | 1,140 | 1,193 | 1,307 | 980 | 1,033 | 932 | 879 |
| 2008 | 1,229 | 1,146 | 1,672 | 861 | 1,391 | 1,342 | 1,617 | 1,521 | 1,469 | 1,787 | 1,847 | 1,899 |
| 2009 | -131 | 1,449 | -13 | -132 | -291 | -190 | -244 | -229 | -131 | -204 | -404 | -14 |
| 2010 | 662 | 337 | 1,059 | 463 | 364 | -427 | -667 | -86 | -46 | 106 | -151 | 1,704 |
| 2011 | 895 | 509 | 191 | 1,680 | 168 | -1,705 | 398 | -1,273 | 253 | 514 | -211 | -344 |
| 2012 | 507 | 234 | -282 | 670 | 1,581 | 146 | -760 | 740 | 793 | 281 | 470 | -82 |
| 2013 | 699 | -371 | 604 | -483 | -570 | -358 | 1,016 | -624 | 99 | -148 | -276 | -625 |
| 2014 | 1,039 | 234 | 259 | 1,512 | -187 | 1,013 | 782 | -1,213 | 191 | -464 | 1,054 | 1,601 |
| 2015 | 1,221 | 660 | -582 | -240 | 331 | -85 | 7 | 20 | -788 | 548 | 576 | -1,226 |
| 2016 | -125 | 1,348 | -182 | 1,659 | 28 | 270 | -169 | -428 | -53 | 175 | -1,051 | -186 |
| 2017 | -605 | -236 | 822 | 553 | -1,719 | -905 | 14 | -1,198 | 498 | 1,269 | 401 | -1,857 |
| 2018 | -891 | 775 | 195 | 1,430 | -145 | 779 | -963 | -166 | 35 | -318 | 611 | -1,122 |
| 2019 | 530 | -1,693 | 943 | 1,273 | -757 | -556 | 1,000 | 16 | 591 | 168 | -1,100 | -441 |
| 2020 | 476 | 403 | -21 | 900 | 435 | -392 | -458 | -1,517 | -454 | -359 | 138 | 772 |
| 2021 | -711 | 1,059 | 944 | 119 | -8 | 734 | -303 | -158 | 335 | 329 | 940 | -873 |
| 2022 | 403 | -1,188 | 1,317 | 1,034 | 2,191 | 515 | 545 | -546 | -288 | -116 | -49 | 510 |
| 2023 | 407 | -424 | 208 | 107 | -259 | -376 | 305 | -470 | 432 | -380 | 129 | -615 |
| 2024 | 219 | |||||||||||
| - = No Data Reported; -- = Not Applicable; NA = Not Available; W = Withheld to avoid disclosure of individual company data. |
| Release Date: 3/29/2024 |
| Next Release Date: 4/30/2024 |