|
Download Data (XLS File) |
|
||||||||
|
||||||||
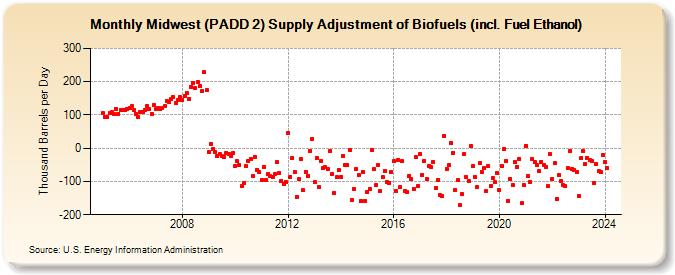
| Midwest (PADD 2) Supply Adjustment of Biofuels (incl. Fuel Ethanol) (Thousand Barrels per Day) | ||||||||
| Year | Jan | Feb | Mar | Apr | May | Jun | Jul | Aug | Sep | Oct | Nov | Dec |
|---|---|---|---|---|---|---|---|---|---|---|---|---|
| 2005 | 105 | 94 | 95 | 107 | 108 | 102 | 119 | 104 | 115 | 114 | 114 | 118 |
| 2006 | 121 | 126 | 114 | 104 | 93 | 110 | 108 | 115 | 127 | 117 | 103 | 130 |
| 2007 | 117 | 122 | 119 | 122 | 126 | 141 | 140 | 148 | 153 | 135 | 144 | 153 |
| 2008 | 146 | 157 | 166 | 149 | 185 | 197 | 181 | 200 | 188 | 171 | 228 | 174 |
| 2009 | -12 | 13 | -2 | -12 | -24 | -17 | -24 | -25 | -15 | -17 | -24 | -15 |
| 2010 | -53 | -40 | -51 | -114 | -104 | -54 | -40 | -32 | -83 | -26 | -65 | -73 |
| 2011 | -95 | -56 | -96 | -78 | -85 | -87 | -79 | -43 | -76 | -99 | -108 | -101 |
| 2012 | 47 | -86 | -31 | -72 | -146 | -94 | -34 | -127 | -71 | -84 | -8 | 28 |
| 2013 | -103 | -29 | -117 | -38 | -60 | -58 | -63 | -8 | -78 | -134 | -88 | -65 |
| 2014 | -86 | -22 | -51 | -51 | -6 | -156 | -123 | -63 | -80 | -159 | -71 | -159 |
| 2015 | -132 | -123 | -4 | -64 | -111 | -52 | -129 | -87 | -68 | -101 | -104 | -72 |
| 2016 | -40 | -128 | -36 | -116 | -40 | -129 | -133 | -83 | -92 | -122 | -28 | -113 |
| 2017 | -17 | -81 | -38 | -93 | -53 | -57 | -41 | -119 | -95 | -142 | -145 | 38 |
| 2018 | -62 | -52 | 15 | -13 | -125 | -96 | -172 | -138 | -17 | -87 | -100 | 7 |
| 2019 | -54 | -86 | -116 | -46 | -72 | -60 | -130 | -54 | -114 | -89 | -103 | -75 |
| 2020 | -127 | -54 | -2 | -38 | -158 | -93 | -111 | -42 | -56 | -32 | -166 | -110 |
| 2021 | 8 | -85 | -101 | -32 | -42 | -52 | -69 | -41 | -50 | -58 | -115 | -18 |
| 2022 | -93 | -45 | -153 | -81 | -98 | -112 | -115 | -61 | -9 | -62 | -66 | -73 |
| 2023 | -143 | -31 | -7 | -49 | -29 | -37 | -39 | -104 | -49 | -70 | -72 | -20 |
| 2024 | -30 | |||||||||||
| - = No Data Reported; -- = Not Applicable; NA = Not Available; W = Withheld to avoid disclosure of individual company data. |
| Release Date: 3/29/2024 |
| Next Release Date: 4/30/2024 |