|
Download Data (XLS File) |
|
||||||||
|
||||||||
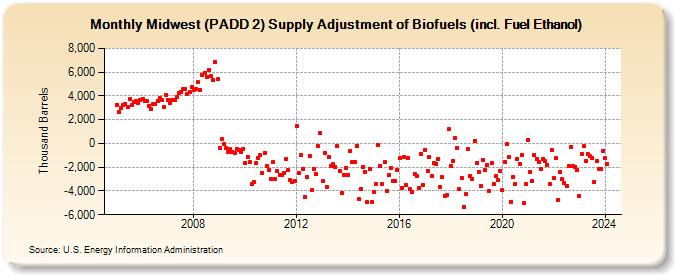
| Midwest (PADD 2) Supply Adjustment of Biofuels (incl. Fuel Ethanol) (Thousand Barrels) | ||||||||
| Year | Jan | Feb | Mar | Apr | May | Jun | Jul | Aug | Sep | Oct | Nov | Dec |
|---|---|---|---|---|---|---|---|---|---|---|---|---|
| 2005 | 3,256 | 2,624 | 2,958 | 3,200 | 3,359 | 3,045 | 3,703 | 3,215 | 3,463 | 3,549 | 3,411 | 3,670 |
| 2006 | 3,747 | 3,530 | 3,533 | 3,122 | 2,877 | 3,292 | 3,347 | 3,576 | 3,823 | 3,634 | 3,099 | 4,043 |
| 2007 | 3,621 | 3,406 | 3,676 | 3,668 | 3,919 | 4,241 | 4,346 | 4,595 | 4,577 | 4,200 | 4,318 | 4,732 |
| 2008 | 4,515 | 4,546 | 5,146 | 4,458 | 5,746 | 5,920 | 5,605 | 6,213 | 5,641 | 5,310 | 6,834 | 5,402 |
| 2009 | -363 | 368 | -71 | -353 | -741 | -508 | -752 | -774 | -449 | -519 | -709 | -463 |
| 2010 | -1,632 | -1,133 | -1,574 | -3,427 | -3,233 | -1,634 | -1,245 | -1,004 | -2,493 | -796 | -1,936 | -2,254 |
| 2011 | -2,953 | -1,560 | -2,982 | -2,333 | -2,645 | -2,621 | -2,448 | -1,347 | -2,272 | -3,081 | -3,232 | -3,129 |
| 2012 | 1,456 | -2,482 | -962 | -2,152 | -4,535 | -2,806 | -1,047 | -3,948 | -2,124 | -2,612 | -225 | 878 |
| 2013 | -3,200 | -806 | -3,631 | -1,141 | -1,871 | -1,740 | -1,950 | -252 | -2,342 | -4,169 | -2,650 | -2,026 |
| 2014 | -2,660 | -604 | -1,589 | -1,538 | -179 | -4,686 | -3,803 | -1,942 | -2,392 | -4,940 | -2,120 | -4,914 |
| 2015 | -4,105 | -3,442 | -133 | -1,917 | -3,426 | -1,564 | -3,989 | -2,697 | -2,041 | -3,124 | -3,131 | -2,244 |
| 2016 | -1,233 | -3,714 | -1,102 | -3,479 | -1,251 | -3,872 | -4,130 | -2,567 | -2,754 | -3,784 | -851 | -3,511 |
| 2017 | -512 | -2,279 | -1,177 | -2,780 | -1,652 | -1,708 | -1,281 | -3,675 | -2,838 | -4,406 | -4,344 | 1,176 |
| 2018 | -1,929 | -1,465 | 480 | -402 | -3,864 | -2,877 | -5,340 | -4,276 | -503 | -2,708 | -3,009 | 212 |
| 2019 | -1,660 | -2,400 | -3,593 | -1,394 | -2,221 | -1,812 | -4,016 | -1,687 | -3,406 | -2,773 | -3,088 | -2,339 |
| 2020 | -3,943 | -1,569 | -75 | -1,133 | -4,900 | -2,793 | -3,428 | -1,316 | -1,692 | -978 | -4,990 | -3,415 |
| 2021 | 256 | -2,378 | -3,130 | -945 | -1,307 | -1,564 | -2,128 | -1,276 | -1,510 | -1,806 | -3,444 | -549 |
| 2022 | -2,868 | -1,251 | -4,741 | -2,421 | -3,027 | -3,349 | -3,567 | -1,904 | -277 | -1,923 | -1,974 | -2,256 |
| 2023 | -4,430 | -858 | -220 | -1,470 | -911 | -1,096 | -1,221 | -3,236 | -1,478 | -2,185 | -2,160 | -635 |
| 2024 | -917 | |||||||||||
| - = No Data Reported; -- = Not Applicable; NA = Not Available; W = Withheld to avoid disclosure of individual company data. |
| Release Date: 3/29/2024 |
| Next Release Date: 4/30/2024 |