|
Download Data (XLS File) |
|
||||||||
|
||||||||
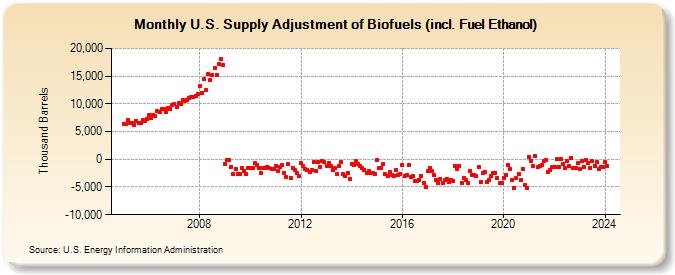
| U.S. Supply Adjustment of Biofuels (incl. Fuel Ethanol) (Thousand Barrels) | ||||||||
| Year | Jan | Feb | Mar | Apr | May | Jun | Jul | Aug | Sep | Oct | Nov | Dec |
|---|---|---|---|---|---|---|---|---|---|---|---|---|
| 2005 | 6,379 | 6,302 | 7,020 | 6,493 | 6,486 | 6,171 | 6,975 | 6,602 | 6,621 | 7,130 | 6,978 | 7,258 |
| 2006 | 7,897 | 7,512 | 8,031 | 7,761 | 8,625 | 8,500 | 9,023 | 8,993 | 8,505 | 9,289 | 9,046 | 9,805 |
| 2007 | 9,900 | 9,407 | 10,194 | 9,972 | 10,639 | 10,469 | 10,642 | 11,119 | 11,150 | 11,213 | 11,464 | 11,752 |
| 2008 | 13,294 | 12,035 | 14,426 | 12,509 | 15,320 | 14,274 | 15,214 | 16,490 | 15,260 | 17,267 | 18,006 | 17,070 |
| 2009 | -882 | -57 | -171 | -1,322 | -2,570 | -1,781 | -2,592 | -2,581 | -1,569 | -2,059 | -2,721 | -1,520 |
| 2010 | -1,646 | -1,604 | -730 | -1,099 | -1,513 | -2,534 | -1,533 | -1,497 | -1,320 | -1,578 | -1,710 | -1,694 |
| 2011 | -1,144 | -2,045 | -1,318 | -966 | -2,417 | -3,253 | -866 | -3,315 | -1,567 | -2,010 | -2,550 | -3,068 |
| 2012 | -728 | -1,240 | -1,699 | -1,908 | -2,224 | -1,897 | -576 | -2,111 | -516 | -1,364 | -347 | -511 |
| 2013 | -1,130 | -648 | -1,180 | -1,882 | -1,643 | -2,632 | -1,218 | -443 | -2,736 | -3,062 | -2,445 | -3,579 |
| 2014 | -868 | -1,079 | -274 | -884 | -1,132 | -1,490 | -1,856 | -2,511 | -2,035 | -2,451 | -2,513 | -2,663 |
| 2015 | -68 | -1,568 | -1,657 | -847 | -2,707 | -2,952 | -2,281 | -2,768 | -2,996 | -1,926 | -2,787 | -2,568 |
| 2016 | -1,092 | -2,941 | -2,842 | -1,006 | -3,179 | -2,993 | -3,880 | -3,949 | -3,783 | -2,966 | -4,299 | -4,938 |
| 2017 | -2,146 | -1,612 | -2,205 | -2,790 | -3,727 | -4,219 | -3,506 | -4,291 | -3,824 | -3,542 | -4,105 | -3,674 |
| 2018 | -3,947 | -1,213 | -1,775 | -1,223 | -4,225 | -3,355 | -3,776 | -4,340 | -2,101 | -2,880 | -2,766 | -3,099 |
| 2019 | -1,320 | -4,010 | -2,537 | -2,264 | -4,096 | -3,722 | -3,084 | -2,455 | -2,419 | -3,466 | -4,305 | -4,231 |
| 2020 | -3,456 | -2,777 | -989 | -1,698 | -3,714 | -5,207 | -3,465 | -2,673 | -3,788 | -1,674 | -4,609 | -5,167 |
| 2021 | 364 | -223 | -1,140 | 586 | -1,446 | -1,247 | -1,123 | -286 | -171 | -2,250 | -1,872 | -1,454 |
| 2022 | -1,312 | -16 | -1,333 | 64 | -793 | -1,585 | -358 | -1,297 | 224 | -1,514 | -1,524 | -726 |
| 2023 | -1,797 | -318 | -1,322 | -92 | -597 | -1,525 | -332 | -1,272 | -435 | -1,787 | -1,440 | -1,472 |
| 2024 | -494 | |||||||||||
| - = No Data Reported; -- = Not Applicable; NA = Not Available; W = Withheld to avoid disclosure of individual company data. |
| Release Date: 3/29/2024 |
| Next Release Date: 4/30/2024 |