|
Download Data (XLS File) |
|
||||||||
|
||||||||
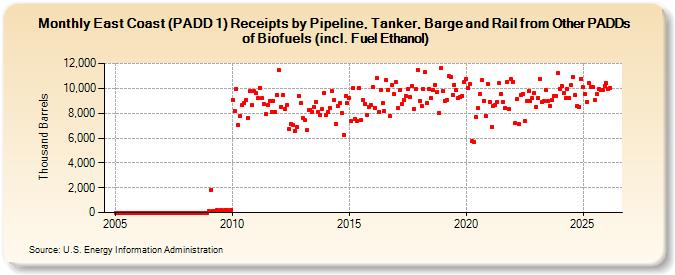
| East Coast (PADD 1) Receipts by Pipeline, Tanker, Barge and Rail from Other PADDs of Biofuels (incl. Fuel Ethanol) (Thousand Barrels) | ||||||||
| Year | Jan | Feb | Mar | Apr | May | Jun | Jul | Aug | Sep | Oct | Nov | Dec |
|---|---|---|---|---|---|---|---|---|---|---|---|---|
| 2005 | 0 | 0 | 0 | 0 | 0 | 0 | 0 | 0 | 0 | 0 | 0 | 0 |
| 2006 | 0 | 0 | 0 | 0 | 0 | 0 | 0 | 0 | 0 | 0 | 0 | 0 |
| 2007 | 0 | 0 | 0 | 0 | 0 | 0 | 0 | 0 | 0 | 0 | 0 | 0 |
| 2008 | 0 | 0 | 0 | 0 | 0 | 0 | 0 | 0 | 0 | 0 | 0 | 0 |
| 2009 | 101 | 1,797 | 130 | 140 | 199 | 114 | 209 | 148 | 192 | 211 | 143 | 233 |
| 2010 | 9,048 | 8,137 | 9,933 | 7,008 | 7,737 | 8,698 | 8,800 | 9,068 | 7,643 | 9,763 | 8,667 | 9,765 |
| 2011 | 9,585 | 9,184 | 10,064 | 9,192 | 8,766 | 7,911 | 8,638 | 8,971 | 8,119 | 8,982 | 8,071 | 9,450 |
| 2012 | 11,439 | 8,524 | 9,448 | 8,340 | 8,665 | 6,701 | 7,109 | 7,057 | 6,588 | 6,882 | 9,360 | 8,812 |
| 2013 | 7,647 | 7,448 | 6,624 | 8,242 | 8,280 | 8,102 | 8,490 | 8,934 | 8,109 | 7,815 | 8,307 | 9,653 |
| 2014 | 7,875 | 8,090 | 8,450 | 9,797 | 9,095 | 7,133 | 8,586 | 8,795 | 8,005 | 6,243 | 9,361 | 8,795 |
| 2015 | 9,229 | 7,341 | 10,039 | 7,536 | 7,331 | 10,007 | 7,459 | 9,048 | 8,750 | 7,853 | 8,527 | 8,671 |
| 2016 | 10,081 | 8,444 | 10,832 | 8,061 | 9,867 | 8,833 | 8,162 | 10,656 | 9,851 | 7,772 | 10,233 | 9,515 |
| 2017 | 10,499 | 8,385 | 9,840 | 8,741 | 9,067 | 9,384 | 9,907 | 9,342 | 10,209 | 8,357 | 9,907 | 11,486 |
| 2018 | 8,991 | 8,578 | 9,921 | 11,277 | 8,819 | 9,963 | 9,205 | 9,850 | 10,302 | 9,712 | 8,049 | 11,602 |
| 2019 | 9,782 | 8,984 | 9,084 | 10,953 | 10,926 | 9,484 | 10,303 | 9,842 | 9,260 | 9,291 | 9,415 | 10,500 |
| 2020 | 10,750 | 10,038 | 10,366 | 5,744 | 5,686 | 7,659 | 8,384 | 9,556 | 10,661 | 9,005 | 7,776 | 10,368 |
| 2021 | 8,933 | 6,919 | 8,573 | 8,635 | 8,929 | 10,400 | 9,580 | 8,900 | 8,411 | 10,545 | 8,298 | 10,736 |
| 2022 | 10,549 | 7,194 | 9,124 | 7,104 | 9,482 | 9,567 | 7,337 | 8,990 | 9,746 | 8,992 | 9,184 | 9,640 |
| 2023 | 8,493 | 9,257 | 10,779 | 8,866 | 9,019 | 9,860 | 8,947 | 8,601 | 9,102 | 9,363 | 9,358 | 10,893 |
| 2024 | 10,260 | |||||||||||
| - = No Data Reported; -- = Not Applicable; NA = Not Available; W = Withheld to avoid disclosure of individual company data. |
| Release Date: 3/29/2024 |
| Next Release Date: 4/30/2024 |
Referring Pages: