|
Download Data (XLS File) |
|
||||||||
|
||||||||
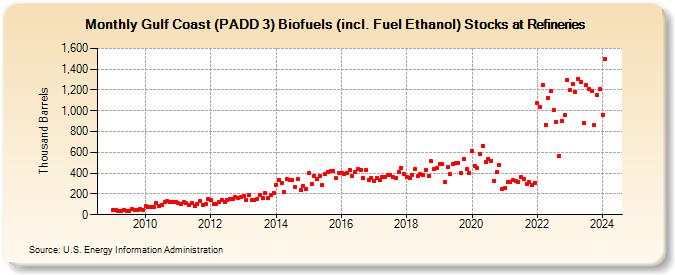
| Gulf Coast (PADD 3) Biofuels (incl. Fuel Ethanol) Stocks at Refineries (Thousand Barrels) | ||||||||
| Year | Jan | Feb | Mar | Apr | May | Jun | Jul | Aug | Sep | Oct | Nov | Dec |
|---|---|---|---|---|---|---|---|---|---|---|---|---|
| 2009 | 44 | 44 | 37 | 38 | 46 | 38 | 37 | 51 | 42 | 47 | 57 | 48 |
| 2010 | 80 | 77 | 79 | 70 | 113 | 82 | 97 | 119 | 133 | 126 | 122 | 121 |
| 2011 | 113 | 104 | 118 | 108 | 93 | 115 | 86 | 106 | 135 | 95 | 100 | 149 |
| 2012 | 137 | 102 | 100 | 127 | 139 | 119 | 140 | 149 | 155 | 172 | 162 | 168 |
| 2013 | 183 | 146 | 185 | 138 | 141 | 152 | 191 | 163 | 206 | 163 | 190 | 211 |
| 2014 | 289 | 337 | 309 | 217 | 339 | 335 | 337 | 268 | 341 | 239 | 276 | 246 |
| 2015 | 399 | 298 | 372 | 341 | 370 | 284 | 391 | 413 | 419 | 423 | 349 | 403 |
| 2016 | 398 | 394 | 402 | 429 | 370 | 414 | 440 | 430 | 352 | 431 | 337 | 357 |
| 2017 | 326 | 349 | 332 | 367 | 358 | 381 | 381 | 367 | 355 | 410 | 449 | 392 |
| 2018 | 364 | 351 | 386 | 439 | 370 | 387 | 382 | 434 | 373 | 513 | 435 | 449 |
| 2019 | 488 | 488 | 314 | 456 | 390 | 492 | 497 | 501 | 405 | 535 | 435 | 406 |
| 2020 | 614 | 469 | 453 | 585 | 662 | 505 | 534 | 521 | 324 | 413 | 479 | 248 |
| 2021 | 258 | 312 | 312 | 330 | 326 | 315 | 358 | 339 | 295 | 316 | 283 | 307 |
| 2022 | 1,070 | 1,040 | 1,251 | 864 | 1,124 | 1,189 | 1,010 | 893 | 568 | 906 | 956 | 1,300 |
| 2023 | 1,196 | 1,253 | 1,185 | 1,310 | 1,276 | 883 | 1,247 | 1,212 | 1,189 | 860 | 1,152 | 1,211 |
| 2024 | 964 | |||||||||||
| - = No Data Reported; -- = Not Applicable; NA = Not Available; W = Withheld to avoid disclosure of individual company data. |
| Release Date: 3/29/2024 |
| Next Release Date: 4/30/2024 |