|
Download Data (XLS File) |
|
||||||||
|
||||||||
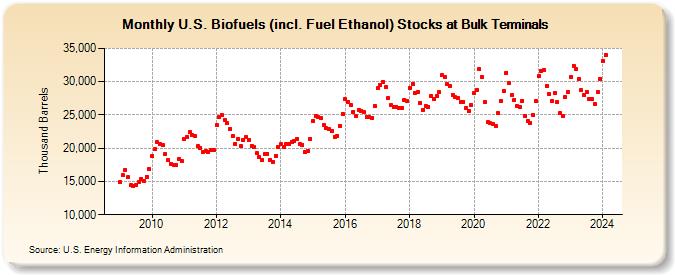
| U.S. Biofuels (incl. Fuel Ethanol) Stocks at Bulk Terminals (Thousand Barrels) | ||||||||
| Year | Jan | Feb | Mar | Apr | May | Jun | Jul | Aug | Sep | Oct | Nov | Dec |
|---|---|---|---|---|---|---|---|---|---|---|---|---|
| 2009 | 14,868 | 15,927 | 16,760 | 15,650 | 14,424 | 14,246 | 14,429 | 14,849 | 15,393 | 15,022 | 15,729 | 16,826 |
| 2010 | 18,796 | 19,839 | 20,879 | 20,662 | 20,430 | 19,122 | 18,150 | 17,661 | 17,540 | 17,440 | 18,341 | 18,051 |
| 2011 | 21,391 | 21,726 | 22,394 | 21,977 | 21,763 | 20,270 | 20,053 | 19,464 | 19,561 | 19,500 | 19,682 | 19,680 |
| 2012 | 23,424 | 24,754 | 24,941 | 24,246 | 23,713 | 22,943 | 21,863 | 20,652 | 21,404 | 20,256 | 21,222 | 21,682 |
| 2013 | 21,238 | 20,403 | 20,161 | 19,223 | 18,648 | 18,249 | 19,123 | 19,181 | 18,214 | 17,957 | 18,789 | 20,156 |
| 2014 | 20,554 | 20,203 | 20,645 | 20,569 | 20,960 | 21,052 | 21,439 | 20,590 | 20,503 | 19,473 | 19,641 | 21,425 |
| 2015 | 24,084 | 24,824 | 24,671 | 24,506 | 23,466 | 22,967 | 22,825 | 22,614 | 21,728 | 21,832 | 23,394 | 25,176 |
| 2016 | 27,327 | 27,008 | 26,511 | 25,488 | 24,771 | 25,784 | 25,626 | 25,367 | 24,761 | 24,655 | 24,608 | 26,308 |
| 2017 | 28,983 | 29,469 | 30,019 | 29,188 | 27,508 | 26,468 | 26,197 | 26,232 | 26,027 | 25,973 | 27,253 | 27,127 |
| 2018 | 29,106 | 29,656 | 28,369 | 28,495 | 26,808 | 25,810 | 26,361 | 26,262 | 27,836 | 27,333 | 27,879 | 28,382 |
| 2019 | 30,934 | 30,716 | 29,591 | 29,285 | 28,032 | 27,627 | 27,511 | 26,905 | 26,949 | 26,027 | 25,648 | 26,458 |
| 2020 | 28,227 | 28,790 | 31,872 | 30,718 | 26,898 | 23,887 | 23,775 | 23,618 | 23,361 | 25,237 | 27,146 | 28,573 |
| 2021 | 31,366 | 29,803 | 28,063 | 27,297 | 26,364 | 26,152 | 27,150 | 24,901 | 24,069 | 23,813 | 25,013 | 27,041 |
| 2022 | 30,845 | 31,571 | 31,772 | 29,313 | 28,071 | 27,157 | 28,309 | 26,978 | 25,220 | 24,795 | 27,757 | 28,509 |
| 2023 | 30,834 | 32,547 | 32,048 | 30,713 | 28,782 | 28,092 | 28,402 | 27,287 | 27,400 | 26,589 | 28,276 | 30,340 |
| 2024 | 33,101 | 34,017 | 35,525 | 34,316 | 30,770 | 31,070 | ||||||
| - = No Data Reported; -- = Not Applicable; NA = Not Available; W = Withheld to avoid disclosure of individual company data. |
| Release Date: 8/30/2024 |
| Next Release Date: 9/30/2024 |