|
Download Data (XLS File) |
|
||||||||
|
||||||||
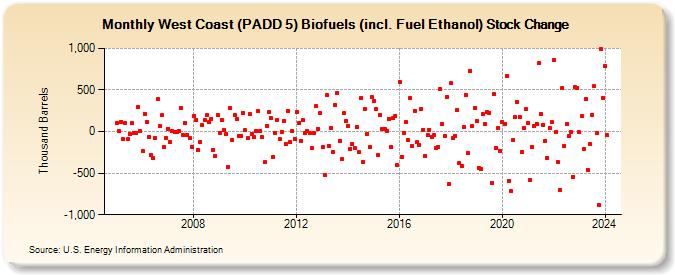
| West Coast (PADD 5) Biofuels (incl. Fuel Ethanol) Stock Change (Thousand Barrels) | ||||||||
| Year | Jan | Feb | Mar | Apr | May | Jun | Jul | Aug | Sep | Oct | Nov | Dec |
|---|---|---|---|---|---|---|---|---|---|---|---|---|
| 2005 | 105 | 4 | 120 | -93 | 101 | -95 | -26 | 99 | -17 | -20 | 295 | 2 |
| 2006 | -238 | 214 | 120 | -62 | -281 | -321 | -72 | 393 | 65 | 195 | -180 | -80 |
| 2007 | 35 | -127 | 9 | -7 | -9 | 4 | 284 | -44 | 106 | -41 | -79 | -183 |
| 2008 | 190 | 141 | -219 | -121 | 75 | 143 | 194 | 110 | 155 | -222 | -292 | 202 |
| 2009 | -14 | 139 | 13 | -25 | -422 | 281 | -97 | 199 | 147 | -51 | -53 | 228 |
| 2010 | 13 | -83 | 214 | -24 | -66 | 4 | 245 | 9 | -69 | -370 | 68 | 232 |
| 2011 | 160 | -302 | -13 | 140 | -94 | 0 | 128 | -152 | 250 | -130 | 6 | -90 |
| 2012 | 236 | 106 | -110 | 134 | -13 | 6 | -14 | -200 | -22 | 303 | 34 | 224 |
| 2013 | -186 | -518 | 435 | -169 | 44 | -246 | 322 | 463 | -109 | -332 | 218 | 125 |
| 2014 | 67 | -207 | -147 | -203 | 53 | -245 | 402 | -369 | 267 | -24 | -186 | 411 |
| 2015 | 369 | 268 | -281 | 203 | 33 | 26 | 12 | 153 | -181 | 158 | 190 | -407 |
| 2016 | 600 | -304 | -18 | 114 | -99 | 402 | -168 | 247 | -131 | -156 | 274 | 22 |
| 2017 | -298 | -45 | 20 | -70 | -42 | -197 | -183 | 510 | 96 | -56 | 417 | -632 |
| 2018 | 581 | -73 | -56 | 257 | -383 | -416 | 53 | 445 | -260 | 732 | 69 | 285 |
| 2019 | 129 | -437 | -454 | 213 | 88 | 237 | 222 | -613 | 454 | -194 | 48 | -239 |
| 2020 | 113 | 86 | 672 | -589 | -717 | -96 | 169 | 352 | 175 | -245 | 46 | 268 |
| 2021 | 106 | -582 | -181 | 72 | 96 | 819 | 210 | 79 | -109 | -320 | 46 | 110 |
| 2022 | 859 | -3 | -370 | -700 | 523 | -168 | 85 | -56 | -5 | -545 | 540 | 528 |
| 2023 | -11 | 186 | -206 | 392 | -465 | -154 | 205 | 544 | -16 | -887 | 998 | 404 |
| 2024 | 787 | |||||||||||
| - = No Data Reported; -- = Not Applicable; NA = Not Available; W = Withheld to avoid disclosure of individual company data. |
| Release Date: 3/29/2024 |
| Next Release Date: 4/30/2024 |